I'm a design-educated research leader with 12+ years driving human-centered strategy across complex enterprise ecosystems from K–12 and higher ed products to interconnected digital platforms with deep interoperability requirements. I build and mentor high-performing teams while staying hands-on with the highest-stakes work. I translate rigorous research into decisions that move organizations forward at the speed strategy actually demands.
12+
Years of UX Research & Design experience
100+
Professionals trained in democratized research
2-3×
Faster delivery via Claude Skills, automated pipelines, & responsible AI
6
Claude Skills built · deployed in active client workflows
I don't just use AI tools. I build AI into how research gets done, responsibly. From Claude Skills that automate quality checks, to agentic workflows that scrape and categorize thousands of data points, to gated frameworks that cut validation from quarters to weeks. I use AI as a multiplier of human effort, not a replacement for judgment, allowing my teams to make faster and more confident decisions.
Selected Work
Case Studies
✦ AI-Integrated
Macmillan Learning — Major EdTech Publisher
Integrating AI into Product Development to Accelerate Discovery
Co-led the design of an AI-accelerated framework transforming a multi-quarter process to validate 5–6 concepts in parallel in just 9 weeks.
2–3× faster5–6 parallel concepts6–9 weeks
Read case study →
Gates Foundation + EdTech Publisher
Creating Tools to Improve Belonging & Metacognition for Underserved Students
Led an 18-month service design and UX research initiative delivering two validated interventions deployed in real classrooms and approved for continued Gates Foundation funding.
10× student engagement2 validated tools18 months
Read case study →
Wiley — Major EdTech Publisher
Redesigning the Assignment Experience to Reduce Anxiety and Increase Confidence
Led a 6-week initiative delivering quick wins and validated wireframes across 4 key opportunity areas, enabling students to focus on learning instead of troubleshooting.
7 quick wins26 student ideas6 weeks
Read case study →
MIT Libraries
Creating a Measurement Framework to Prioritize Improvements to Library Search and Discovery
Led a four-month initiative transforming overwhelming data into a structured diagnostic system with 50+ metrics organized into 9 clusters and a three-tiered implementation roadmap.
50+ metrics9 clusters6 strategic pillars
Read case study →
✦ AI-Integrated
Major EdTech Publisher
Redesigning Course Setup to Support Instructors' Pedagogical Goals
Led a comprehensive research and design initiative transforming course creation from a barrier to adoption into a clear, instructor-driven experience — and establishing a new way of working for the client.
6 teams aligned3 implementation slicesNew working model
Read case study →
Openfield — Internal Project
Creating Career Development Pathways that Scale
Co-created the Pathways framework defining five developmental levels across four competency dimensions, resulting in higher engagement, increased tenure, and transparent promotions.
3/3 roles promoted internally5 levels4 dimensions
Read case study →
✦ AI-Integrated
Macmillan Learning — Major EdTech Publisher
Building a Research Democratization Program That Scaled Itself
Designed and launched a governed research democratization program at a major EdTech publisher, giving product, editorial, and design teams the tools and training to conduct rigorous research independently, with quality checkpoints built into every step.
8 research templates2 years running5× less oversight needed
Read case study →
Major EdTech Publisher
Building a Competitive Usability Benchmarking Program That Shaped Product Strategy
Built and ran an annual PURE usability benchmarking program from the ground up, evaluating 25 instructor workflows against two major competitors. Designed the methodology, coached and led an expert evaluation team, and translated findings into roadmap decisions that were prioritized for each product vertical.
25 tasks across 5 verticals62% vs. 40% vs. 24% Green2-year YOY program
Read case study →
Open to new opportunities
Let's work together.
I'm always interested in connecting with teams who care about doing research well — whether that's a new role, a consulting engagement, or just a good conversation about the work.
Creating Tools to Improve Belonging & Metacognition for Underserved Students
Students who feel belonging and understand how they learn best are more likely to stay in school. Black, Latino, Indigenous, and low-income students often face systemic barriers that undermine both, contributing to higher dropout rates. Our client partnered with the Gates Foundation to develop digital interventions addressing this challenge. I led an 18-month service design and UX research initiative that delivered two validated interventions that were deployed in real classrooms and approved by the Gates Foundation for continued funding.
2
Validated engagement tools
10×
Increase in student engagement vs previous semesters
4×
Increase in participating classes
The Challenge
The Problem
Students who don't feel belonging and don't reflect on how they learn are more likely to drop out—especially Black, Latino, Indigenous, and low-income students.
The Complexity
Our client's learning science team won the grant but lacked UX and Product Strategy expertise to convert academic research into classroom interventions. The project required navigating a complex stakeholder ecosystem with distinct priorities: Gates Foundation (funder), our client (product owner), instructors (implementers), and students (end users). Students would use the tools, but instructors would need to adopt them in their courses. Success meant designing interventions grounded in deep student understanding while balancing needs across all stakeholder groups.
My Role & Approach
I led the research strategy and service design process, managing a cross-functional team of designers, researchers, and co-ops to synthesize insights from 300+ research touchpoints, orchestrate multi-city co-creation sessions, and navigate complex stakeholder relationships from discovery through implementation.
What this required
Mapping student experiences and systemic relationships to identify high-leverage intervention points
Building alignment across silos through strategic engagement with each stakeholder group
Securing ongoing support across leadership levels by crafting research narratives that resonated with both our client's C-suite and Gates Foundation priorities, ensuring continued investment throughout the 18-month timeline
Establishing measurement criteria that enabled continuous refinement and data-driven decisions
De-risking implementation by prototyping with existing tools before requesting engineering resources
Phase 1: Foundational Research
Research at such a large scale was necessary in order for us to deeply understand challenges faced by Black, Latino, Indigenous, and lower-income students. We spoke with students entering college for the first time, those coming back for a second attempt, and working adults supporting families while pursuing degrees.
140
Foundational interviews
85
Student workshop participants
36
Instructor interviews
Student Journey Mapping Workshops
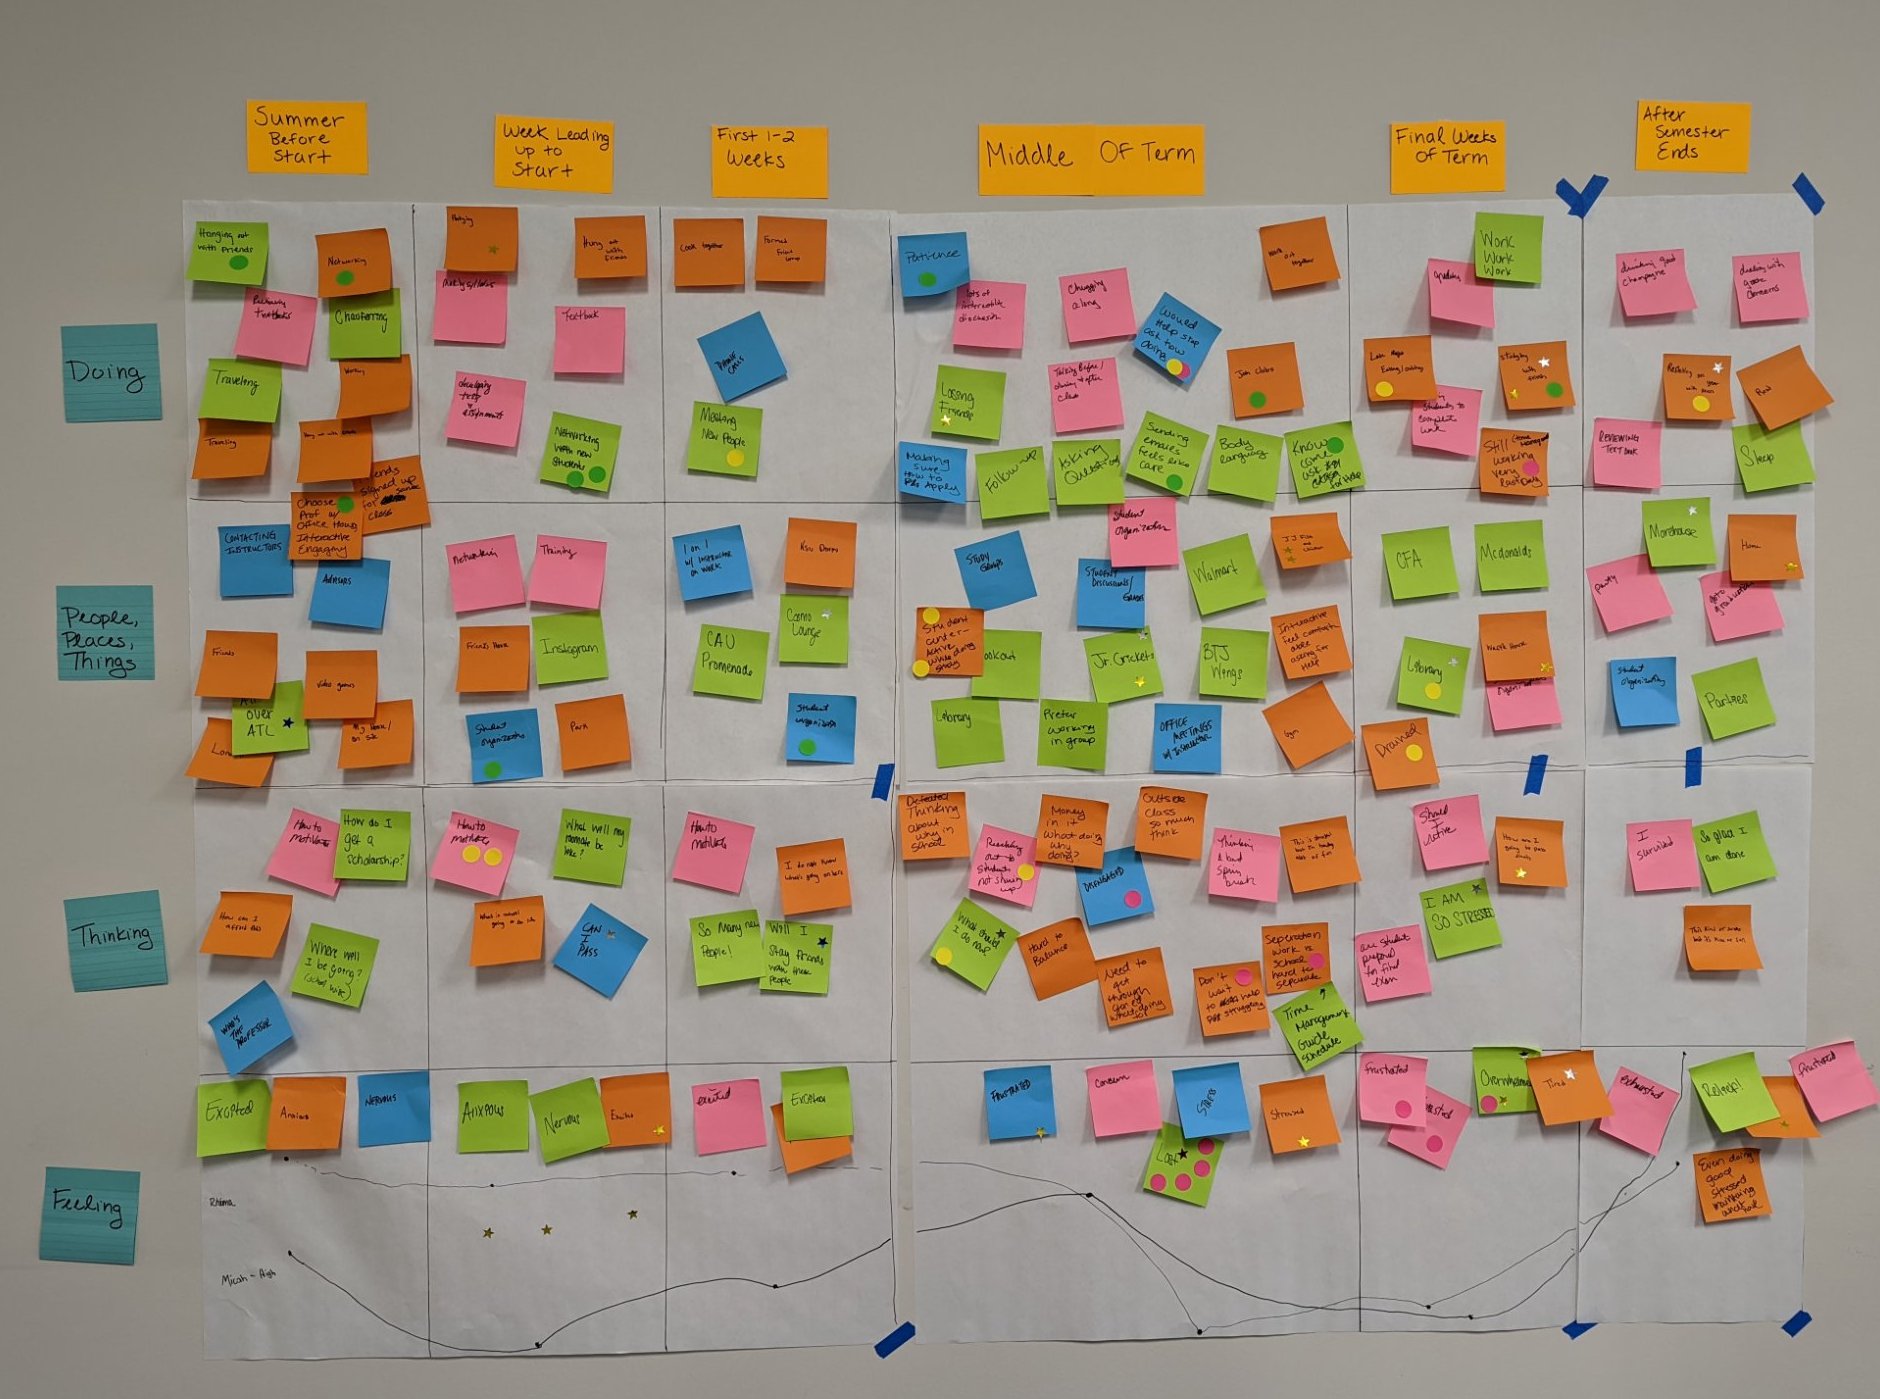
I mapped the student journey through the term, identifying critical touchpoints where sense of belonging and metacognition intersected with academic success. This ecosystem view revealed not just individual pain points, but systemic relationships between students, support services, instructors, and institutional processes.
Student journey map spanning Summer Before Start through After Semester Ends — tracking what students were doing, thinking, feeling, and the people and places in their lives
Creating Challenge Statements
Through strategic synthesis sessions with stakeholders, I transformed this overwhelming volume of data into structured challenge statements written in students' own voices with the onus placed on systems, not individuals. For example:
Commitments to my life outside of college make it challenging to prioritize school work
It's difficult to ask for help when I need it (I've always been taught to solve problems on my own)
There's not a role model/mentor/advisor in my life who can relate to my specific challenges
No one prepared me to understand college-related finances
Prioritizing Which Challenges to Solve
To determine which challenges mattered most and to whom, I designed and deployed a survey reaching a wider audience of students. Working with the cross-functional team, we prioritized which statements would be most impactful based on which were most critical to students, and which we could address most effectively through digital interventions. We aligned on:
It's difficult to ask for help when I need it Sense of Belonging
No one taught me how I learn best Metacognition
Phase 2: Co-Creation & Concept Development
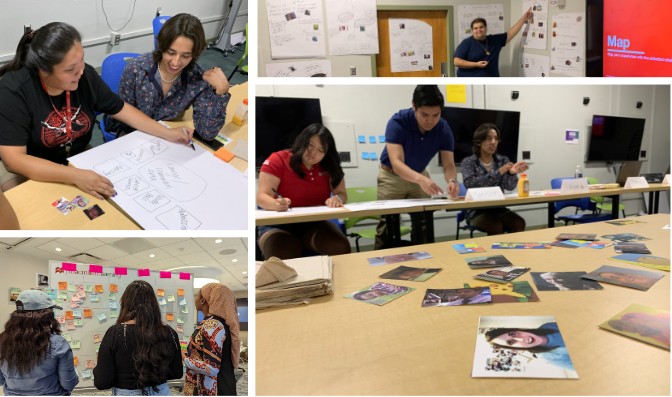
I designed co-creation sessions with students and instructors across the country, including at HBCUs and the University of Arizona's Indigenous Student Organization.
Iterating Through Multiple Rounds
Through multiple rounds of in-person and remote collaboration sessions, we refined concepts from initial sketches to testable product solutions using storyboarding and rapid prototyping.
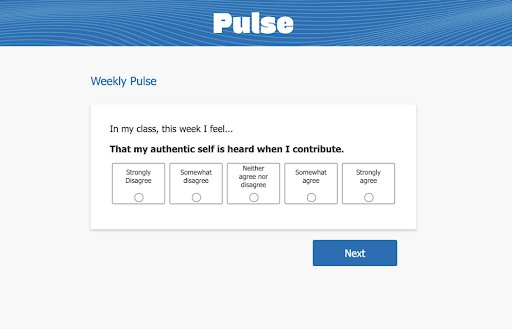
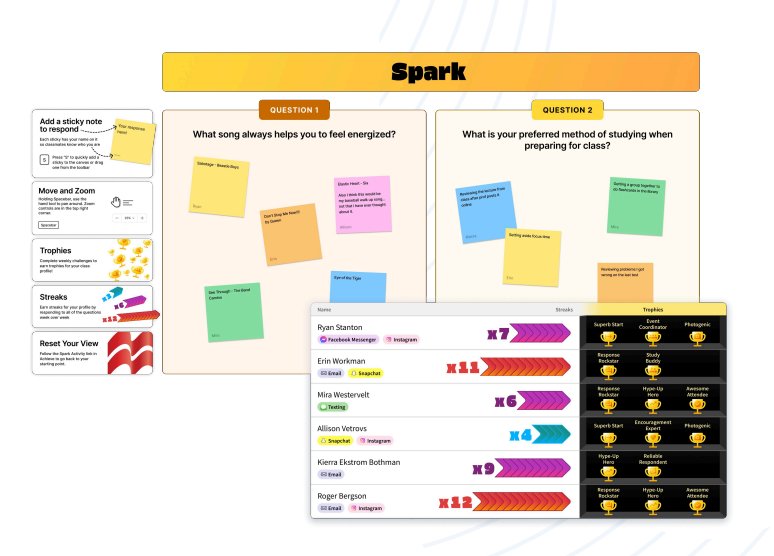
This iterative process revealed two complementary concepts that worked as a system: one created individual reflection loops addressing metacognition (Pulse), while the other built peer support infrastructure, addressing sense of belonging (Spark).
Multi-city co-creation sessions with students, including at HBCUs and the University of Arizona’s Indigenous Student Organization
Phase 3: Implementation Strategy
In order to make a case for engineering funding, we needed to prove success with a prototyped implementation in a class setting. Therefore, I led the team toward strategic tool simulation using existing platforms.
Testing with Existing Tools
This approach enabled us to test intervention concepts within real classroom environments quickly, gathering authentic usage data to inform future development.
Pulse Implementation: Google Forms + Data Studio created functional sentiment tracking with real-time visualization, enabling rapid deployment and iteration
Spark Implementation: Discord with Zapier automation initially, then pivoted to FigJam after receiving mixed feedback regarding Discord
This prototype-first approach reduced risk while accelerating learning. We could test whether the concepts worked before committing to custom development.
Creating the Monitoring Strategy
Tracking weekly engagement metrics
Learning science partnership to measure impact on sense of belonging and metacognition through validated instruments
Mid-term and end-of-term interviews with students and instructors
Measurable Impact & Outcomes
Organizational Impact
Fulfilled high-profile grant deliverables
Positioned our client strategically for future Gates Foundation partnerships
Delivered functional prototypes across multiple institutional partners in classroom environments
Maintained strong Gates relationship through transparent communication and iterative engagement
Research & Strategic Impact
10× increase in tool engagement compared to previous baseline, enabling robust data collection
Validated concepts demonstrably addressing belonging and metacognitive development challenges
Created integration frameworks enabling incorporation into our client's existing product portfolio
“You guys hit this out of the park. There's such a variety to choose from. I see all this feedback we've collected and say, 'how in the world are we going to get this into a digital resource?' This makes it real for me.”
— Our Client's Leadership Team
“If the folks on this team could break off and start their own EdTech company, they would probably get a large investment based on what I've seen on these few slides. If I could, I'd put a million in. I think you've really nailed an opportunity here to help these students be more successful in these courses.”
— Gates Foundation Representative
“The experience was phenomenal and spoke to the heart of my teaching philosophy and dissertation. It is all about connections so that students feel as though they belong.”
— Participating Instructor
Wiley — Major EdTech Publisher
Redesigning the Assignment Experience to Reduce Anxiety and Increase Confidence
Technical constraints and poor information architecture amplified assignment complexity in the initial launch of our client's next-gen learning platform. As students became frustrated and overwhelmed, they emailed their instructors, who were then forced to field hundreds of complaints. This, in turn, overloaded our client's CX team with instructor complaints. To help, I led a 6-week initiative delivering quick wins and validated wireframes across 4 key opportunity areas, enabling students to focus on learning instead of troubleshooting.
4
Key opportunity areas uncovered
7
Quick wins identified
26
Student-generated ideas validated
The Challenge
The Problem
Our client launched their next-generation platform focusing on instructors, but poor student experience was threatening adoption and retention. The company knew something wasn't working but lacked research infrastructure to understand what students needed and how to prioritize fixes.
The Complexity
Students struggled to complete assignments not because of academic difficulty, but because the platform worked against them. The assignment interface was trapped in an iFrame within the LMS, making navigation confusing. Critical information about assignment length, due dates, and time limits was hidden until students were mid-assignment. Formatting errors were penalized like wrong answers, and students couldn't access hints without losing their place.
My Role & Approach
I led a rapid 6-week initiative that combined in-context research (homework probes during actual assignments), co-creation workshops with students, and multi-round validation testing.
What this required
Contextualizing the full student experience to reveal where anxiety peaked and confidence broke down
Designing workshop-based research that maximized learning and validation within tight timelines
Testing wireframes across diverse student populations, institutions, and disciplines before engineering investment
Separating immediate improvements from long-term vision to deliver value while building toward comprehensive solutions
Phase 1: Student Co-Creation Workshop
We started by reaching out to students before the co-creation session to understand what they were experiencing in real-time. Through homework probes (short surveys students completed while actually doing their assignments) we captured their frustrations as they happened, not just what they remembered later.
Designing the Workshop Structure
I designed a four-part structure building from individual reflection to collaborative problem-solving: gallery walk, experience mapping, brainstorming, and finalizing solutions. Students could bring friends from class, improving attendance and creating a comfortable environment for honest feedback.
Part 1: Gallery Walk
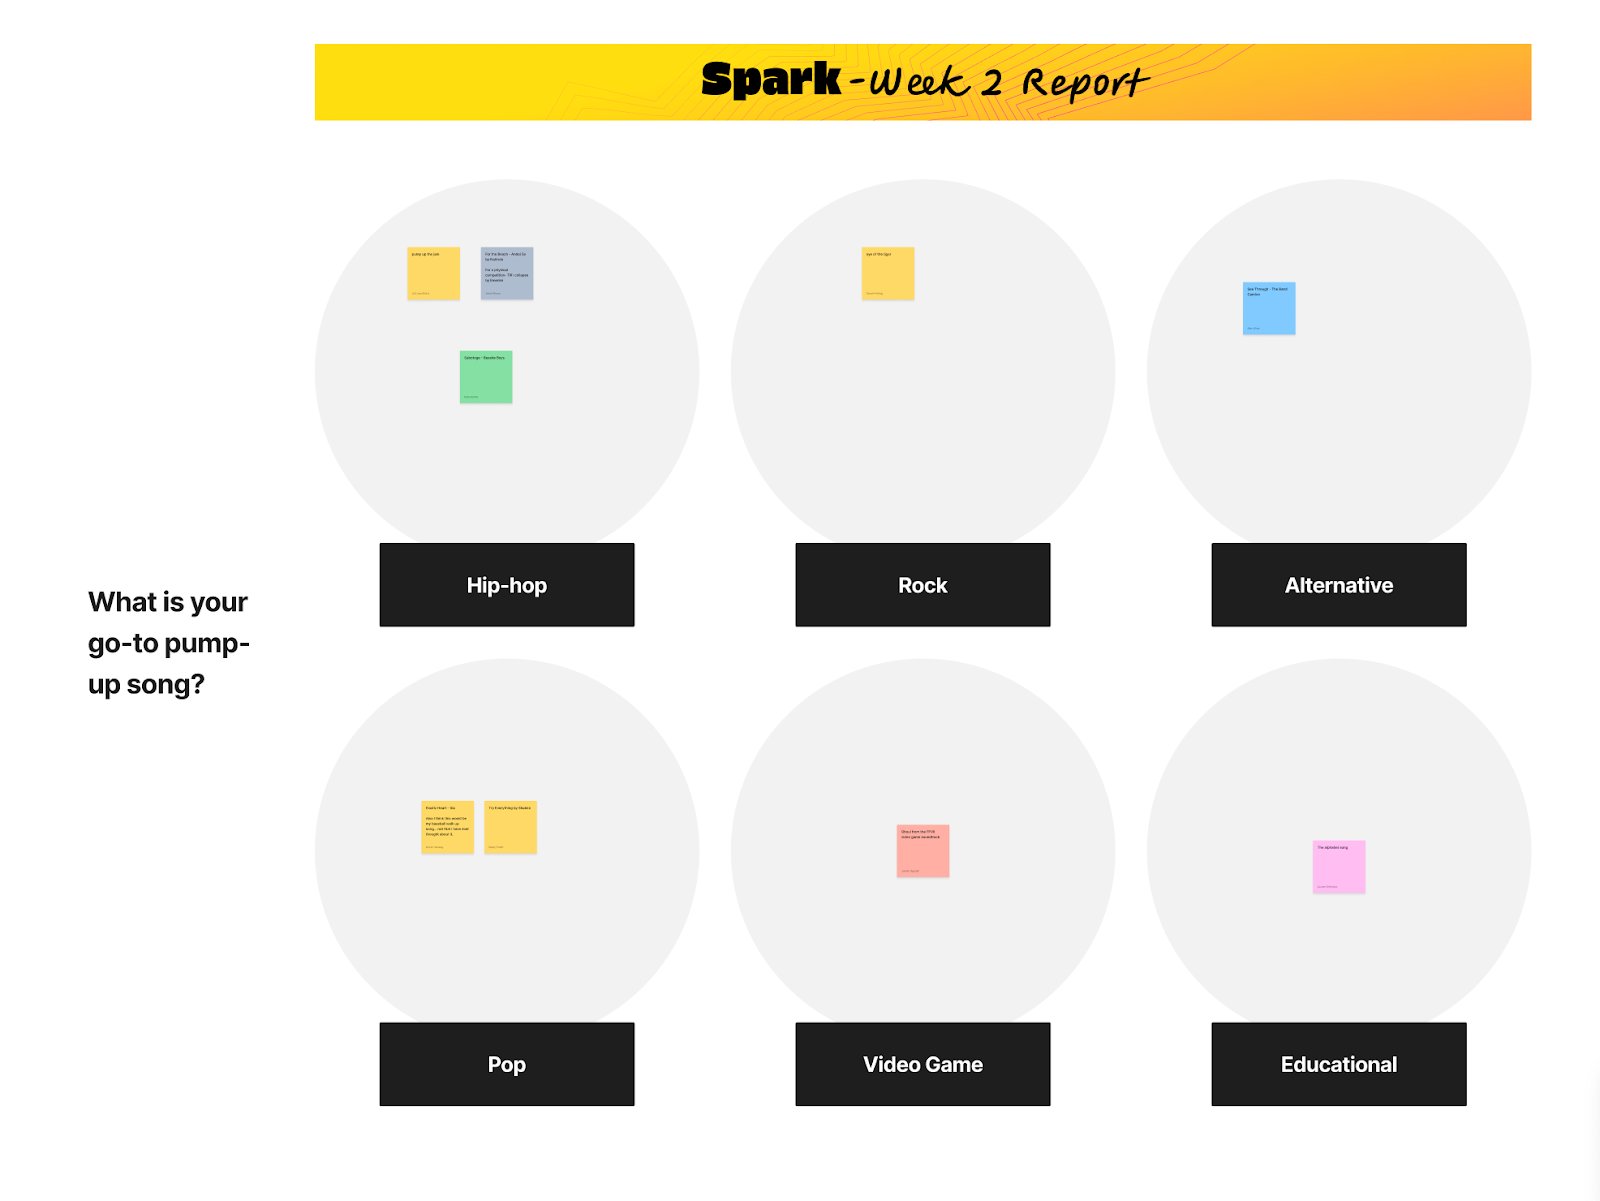
Students walked through printed screens of the existing assignment interface, annotating the screens with sticky notes about what was working and what wasn't. From this activity, we identified 7 potential quick wins that could be implemented immediately without major redesign, like disabling auto-submission notifications and helping students understand which part of multi-part questions was incorrect.
Part 2: Experience Mapping
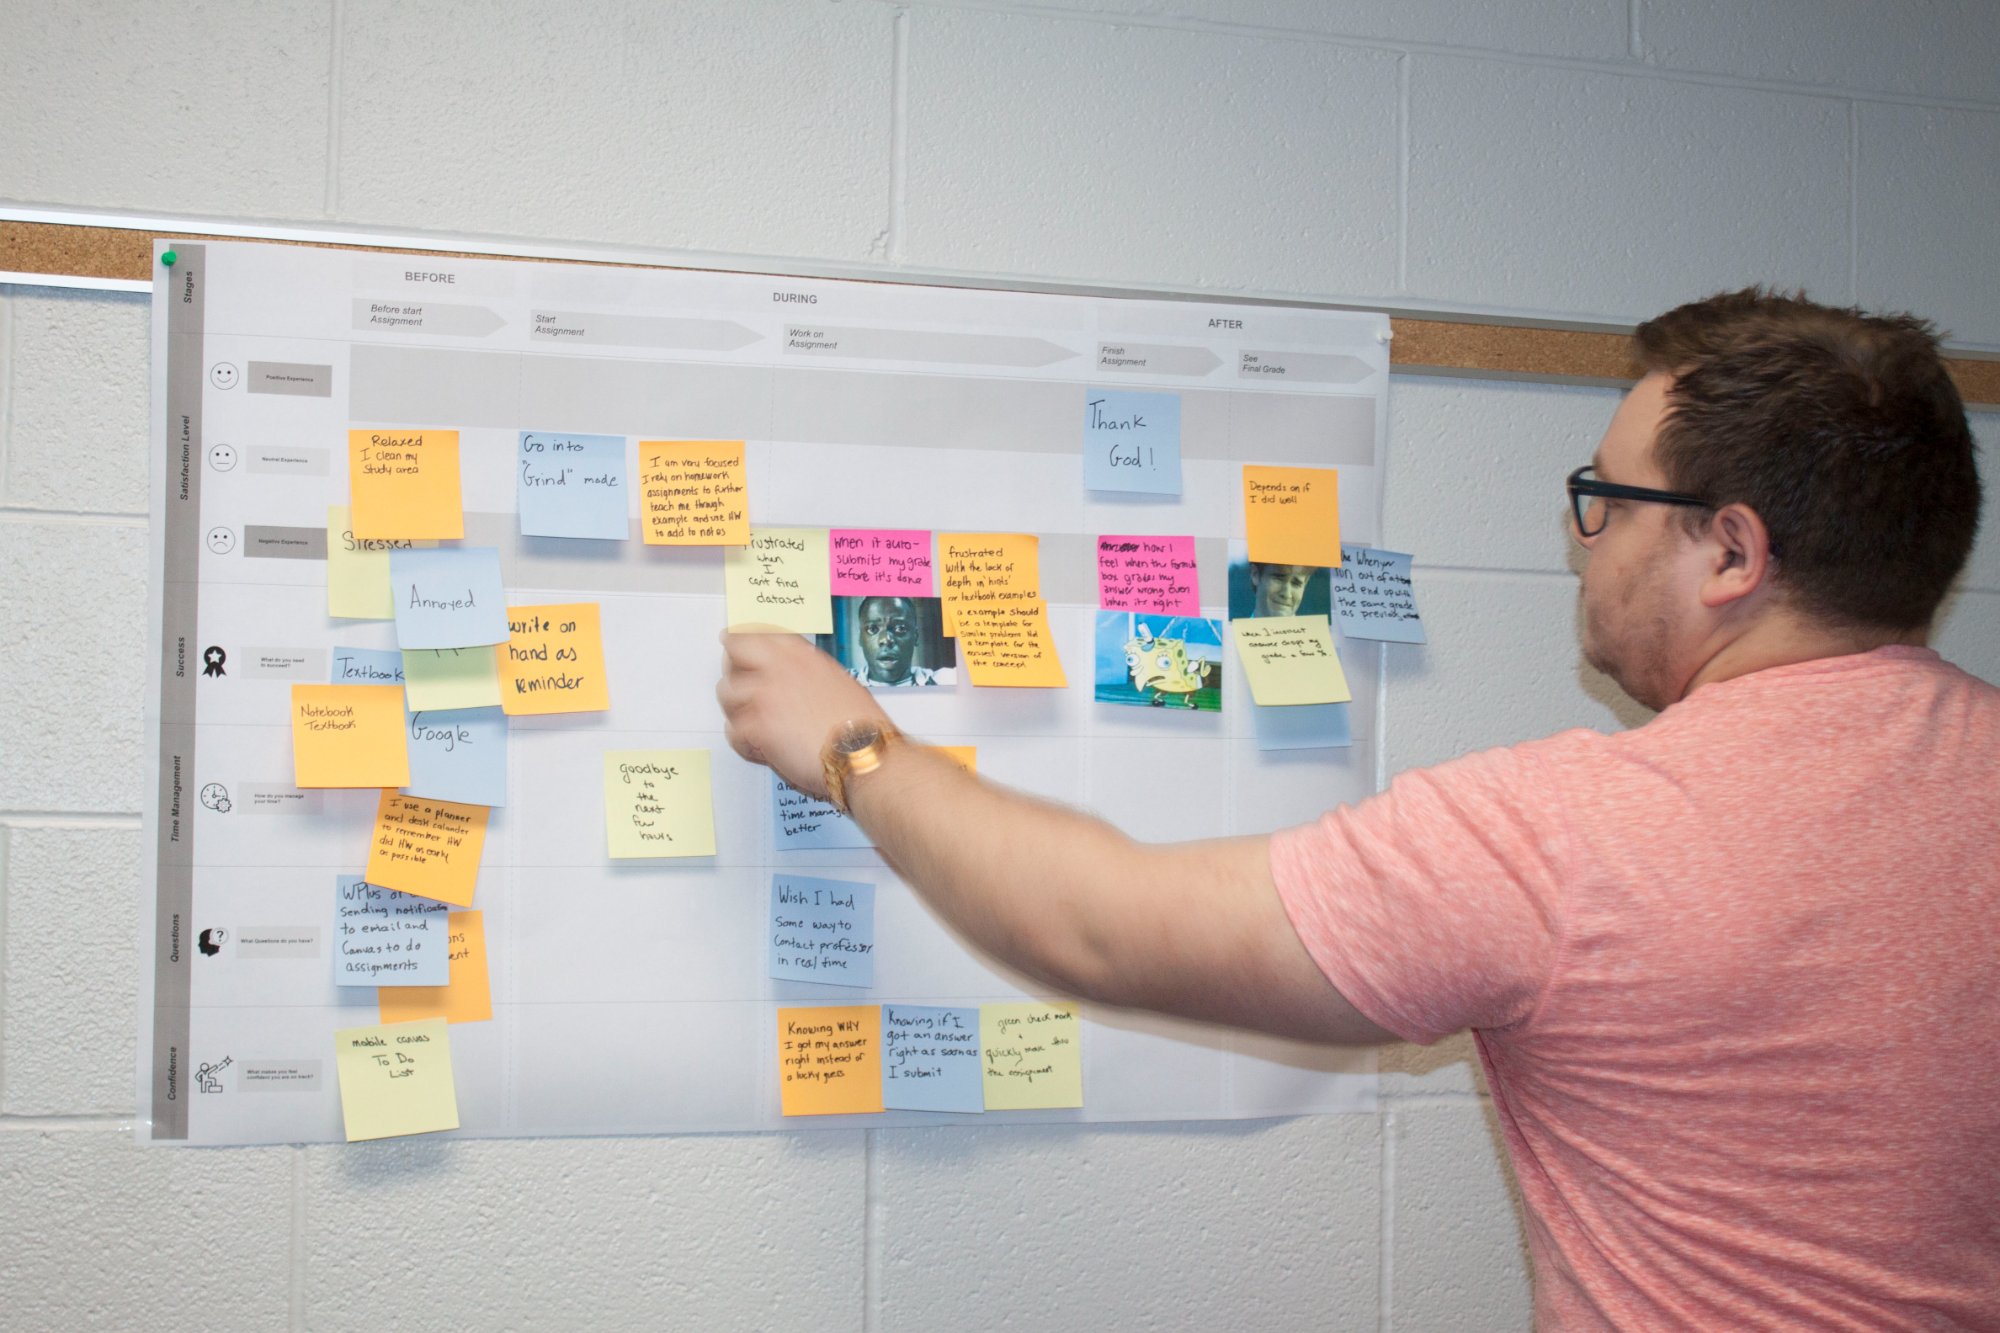
Students documented their feelings, questions, and needs at three stages: before starting an assignment, during the assignment, and after completion. I asked students to use memes to explain their emotional states, capturing nuance that words alone couldn't express.
We learned: anxiety peaked around uncertainty and lack of control, not academic difficulty. Students dreaded formatting issues before starting, felt frustrated by slow page loads during assignments, and felt angry when correct answers were marked wrong due to formatting. This surfaced 4 major opportunity areas: Time Management, Formatting Support, Learning/Hint Access, and Notifications.
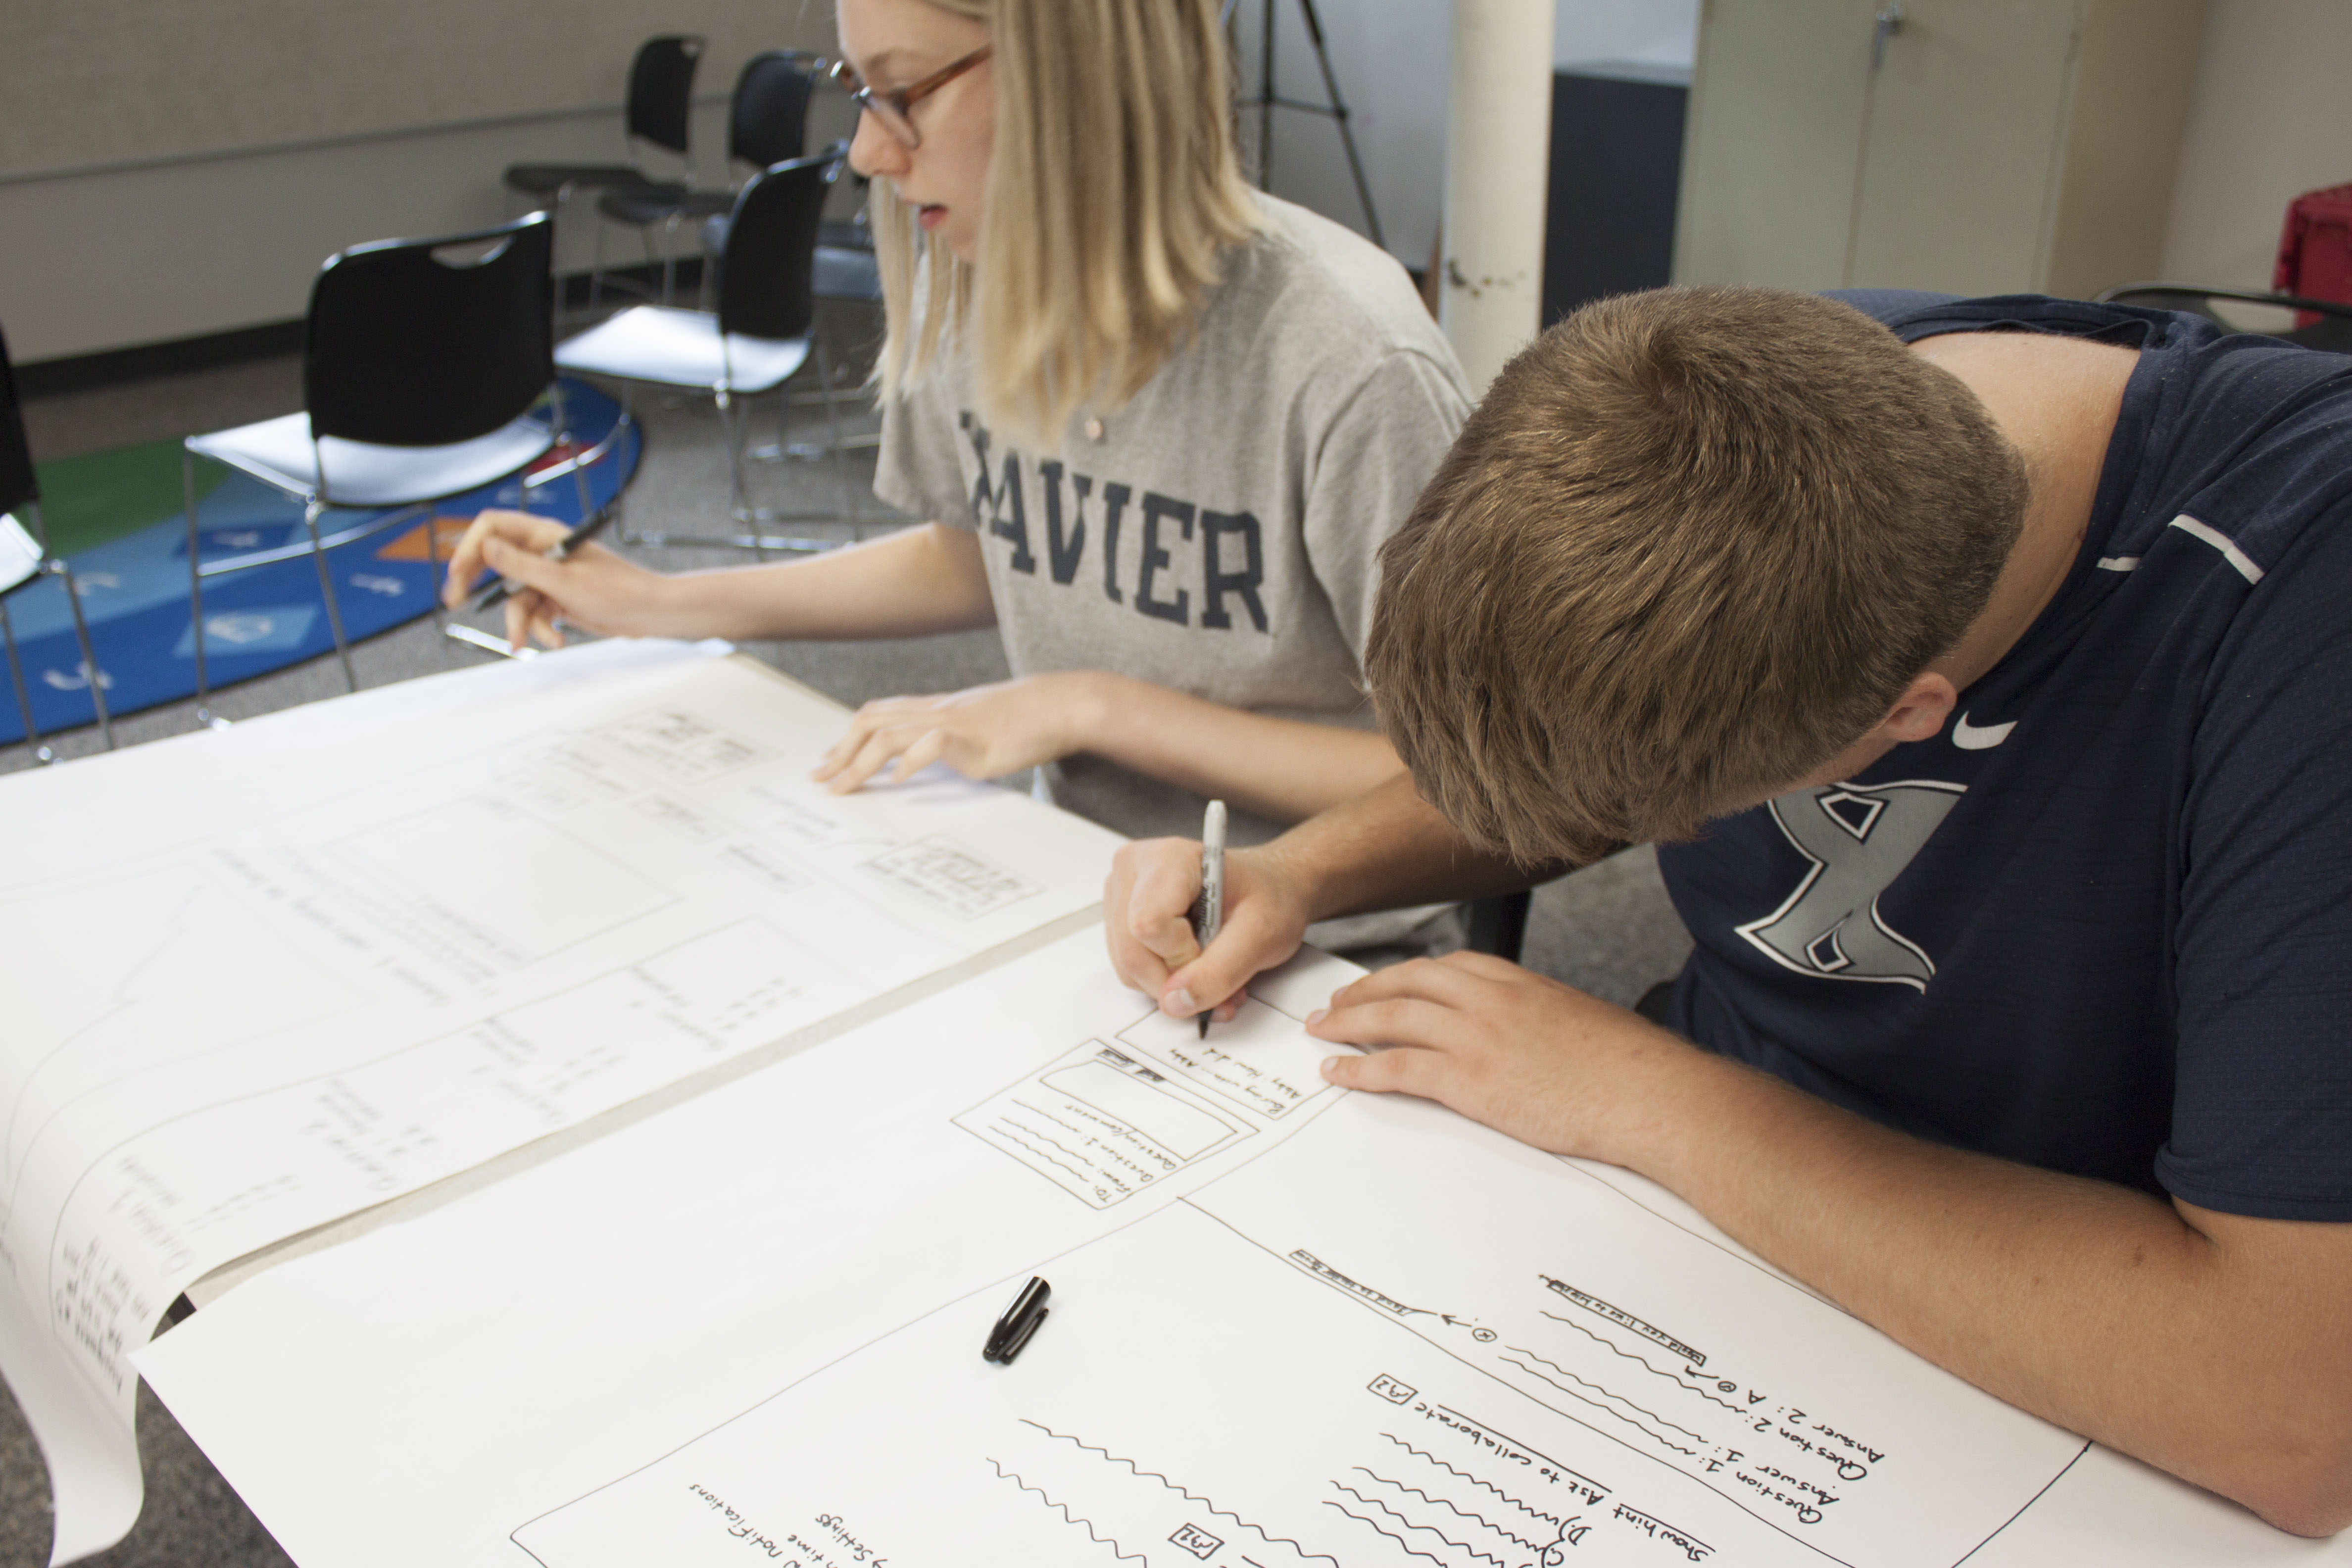
Part 3: Brainstorming Solutions
Students brainstormed solutions for the specific pain points from the experience map. This produced 26 concrete solution ideas across the four opportunity areas. We prioritized which ideas would have the highest impact. Then, students sketched more detailed interface concepts showing how ideas could work together within their assignments. This collaborative approach helped the team get further, faster within our tight timeline, while aligning to student needs.
Phase 2: Design & Validation
I helped the team further refine and prioritize the ideas that came out of the student co-creation workshop, facilitating conversations between design, product, and engineering about what would have the greatest impact and feasibility. We focused on three strategic directions (Updated Cover Page, Streamlined Navigation, Breaking Out of iFrame) identified in the workshop, which addressed multiple opportunity areas from the student experience mapping exercise.
After the design team mocked up prototypes, I designed validation testing to ensure solutions worked across different LMS configurations and disciplines. Testing happened in two rounds with iteration between them, refining the designs based on what we learned.
Measurable Impact & Outcomes
Organizational Impact
Delivered validated wireframes ready for engineering implementation, reducing development risk
Separated immediate fixes from long-term strategy, enabling parallel workstreams
Reduced customer experience team burden by addressing root causes of instructor complaints
Positioned our client competitively by addressing the student experience gap hindering platform adoption
Research & Strategic Impact
Identified 7 quick wins that could ship immediately with minimal engineering effort
Generated 26 solution concepts directly from student needs through structured co-creation
Validated 3 core design improvements across 10 institutions and 5 disciplines
Organized insights into 4 problem areas that created clear strategic direction
Delivered everything in a 6-week timeline from homework probes through validated wireframes
Educational Impact
Reduced student anxiety during assignments by providing clarity, control, and progress visibility
Increased assignment completion rates by removing technical barriers unrelated to academic difficulty
Reduced cognitive load so students could focus on learning rather than troubleshooting the platform
Created a more equitable experience where students weren't penalized for unclear interface conventions
MIT Libraries
Creating a Measurement Framework to Prioritize Improvements to Library Search and Discovery
MIT Libraries had 40+ user interviews and behavioral data across siloed systems, but lacked a framework to prioritize improvements. Without it, they couldn't confidently decide where to invest resources. I led a four-month initiative that transformed overwhelming data into a structured diagnostic system, organizing 50+ metrics into 9 clusters with a three-tiered implementation roadmap that enabled evidence-based decisions.
50+
Metrics organized into 9 diagnostic clusters telling holistic stories
3
Implementation tiers for immediate and long-term impact
6
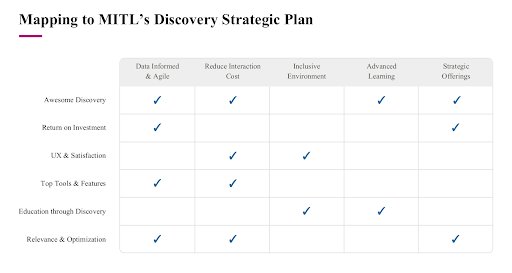
Strategic pillars connecting data to MIT's strategic vision
The Challenge
The Problem
MIT Libraries had a wealth of research but couldn't align on next steps. The team knew users struggled with research discovery but were indecisive about how to proceed. To move forward confidently, they needed to know which problems were most important to prioritize.
The Complexity
MIT Libraries operates a complex ecosystem—Bento, Primo, ArchivesSpace, DSpace, LibGuides, and various other systems users navigate while searching for resources. Each system had its own stakeholders, analytics capabilities, and constraints. Without a shared framework for prioritizing improvements, decisions stalled as teams pursued competing priorities. Success required alignment across systems, stakeholders, and strategy.
My Role & Approach
I served as UX Director and Lead UX Researcher, managing a team of researchers and partnering closely with the Design Director to ensure complex deliverables were accessible and implementable. My approach focused on translating disparate insights into coordinated action that aligned with technical realities and the Library's multi-year strategic vision.
What this required
Co-building the framework, positioning stakeholders as experts whose knowledge needed structure
Organizing around the user journey rather than systems or departments to reflect actual user experience
Balancing strategic value with technical reality by co-designing with implementation teams
Enabling immediate action while building toward depth through tiered implementation
Leveraging design to make complex data accessible—formatting documentation, visualizing relationships, and structuring information so diverse stakeholders could understand and implement the framework
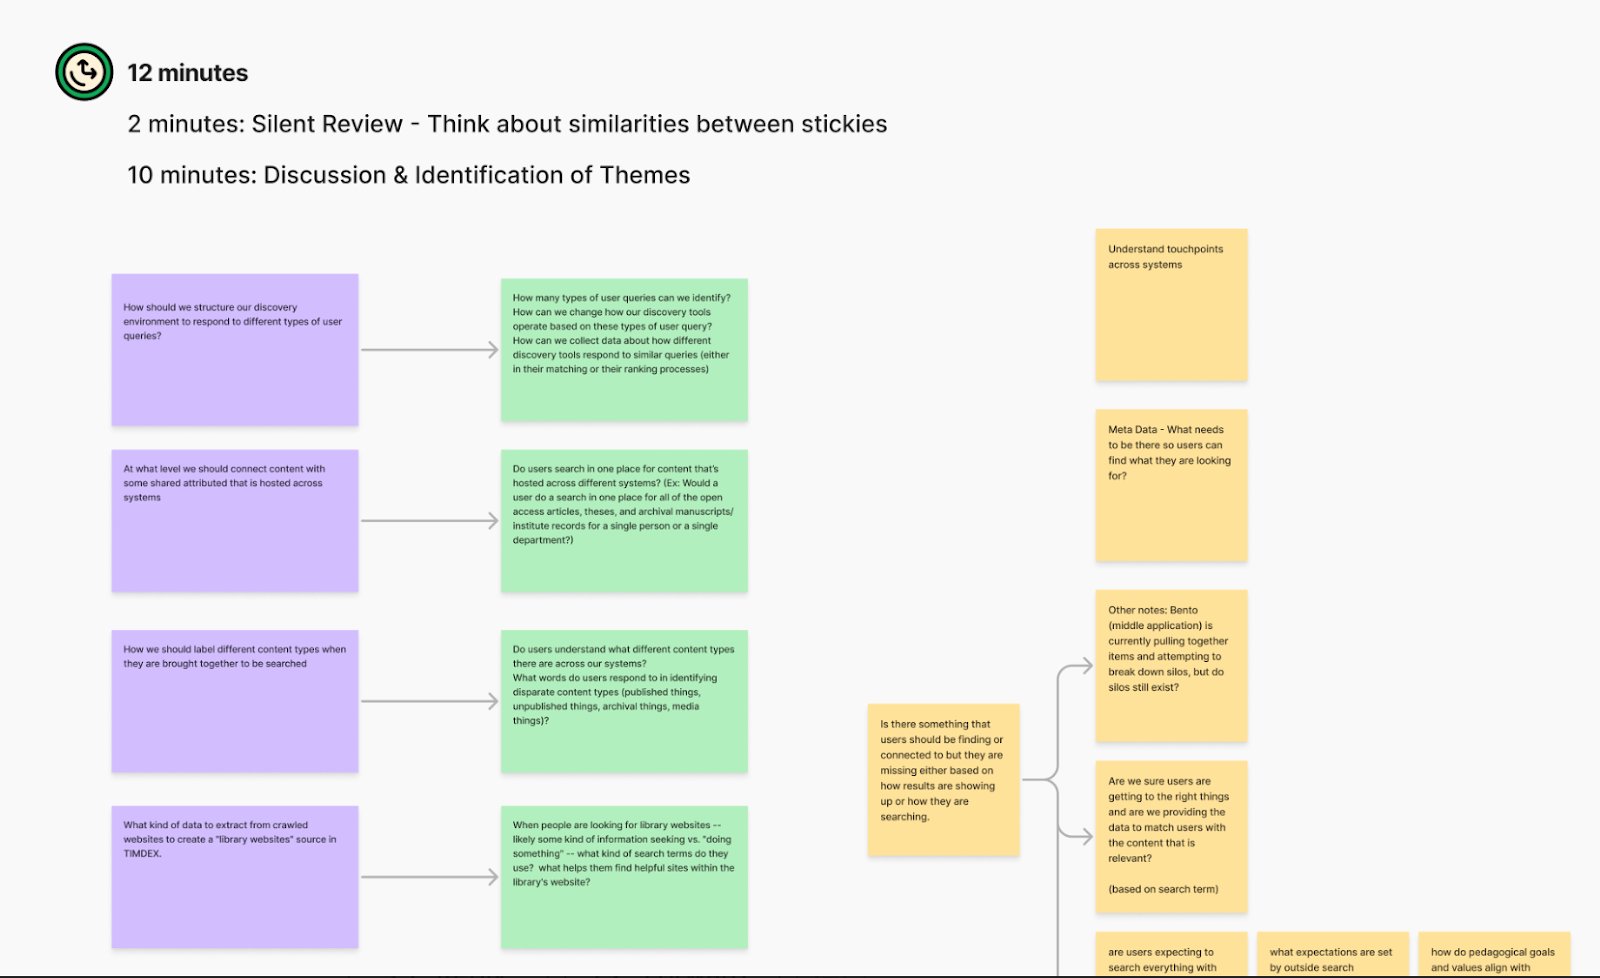
Phase 1: Strategic Alignment Workshop
Before defining any metrics, we needed to understand what questions stakeholders actually needed answered. I designed a structured workshop process that would surface the real decision points required for action.
Understanding What Mattered to Each Stakeholder
Knowing MIT stakeholders were busy but thoughtful, we designed a worksheet that let them contribute on their own time. Rather than ask: What metrics do you want? I asked: What decisions do you need to make in your role? What questions must you answer to make those decisions confidently? This approach resulted in specific, contextual needs instead of generic requests.
Aligning Stakeholders Around Common Goals
During the workshop, I facilitated a synthesis process where patterns began to surface. Questions that seemed disparate when viewed by department or system revealed themselves as connected when viewed through the lens of a user journey. Through collaborative discussion, six strategic pillars emerged from these patterns.
Phase 2: Workflow Mapping
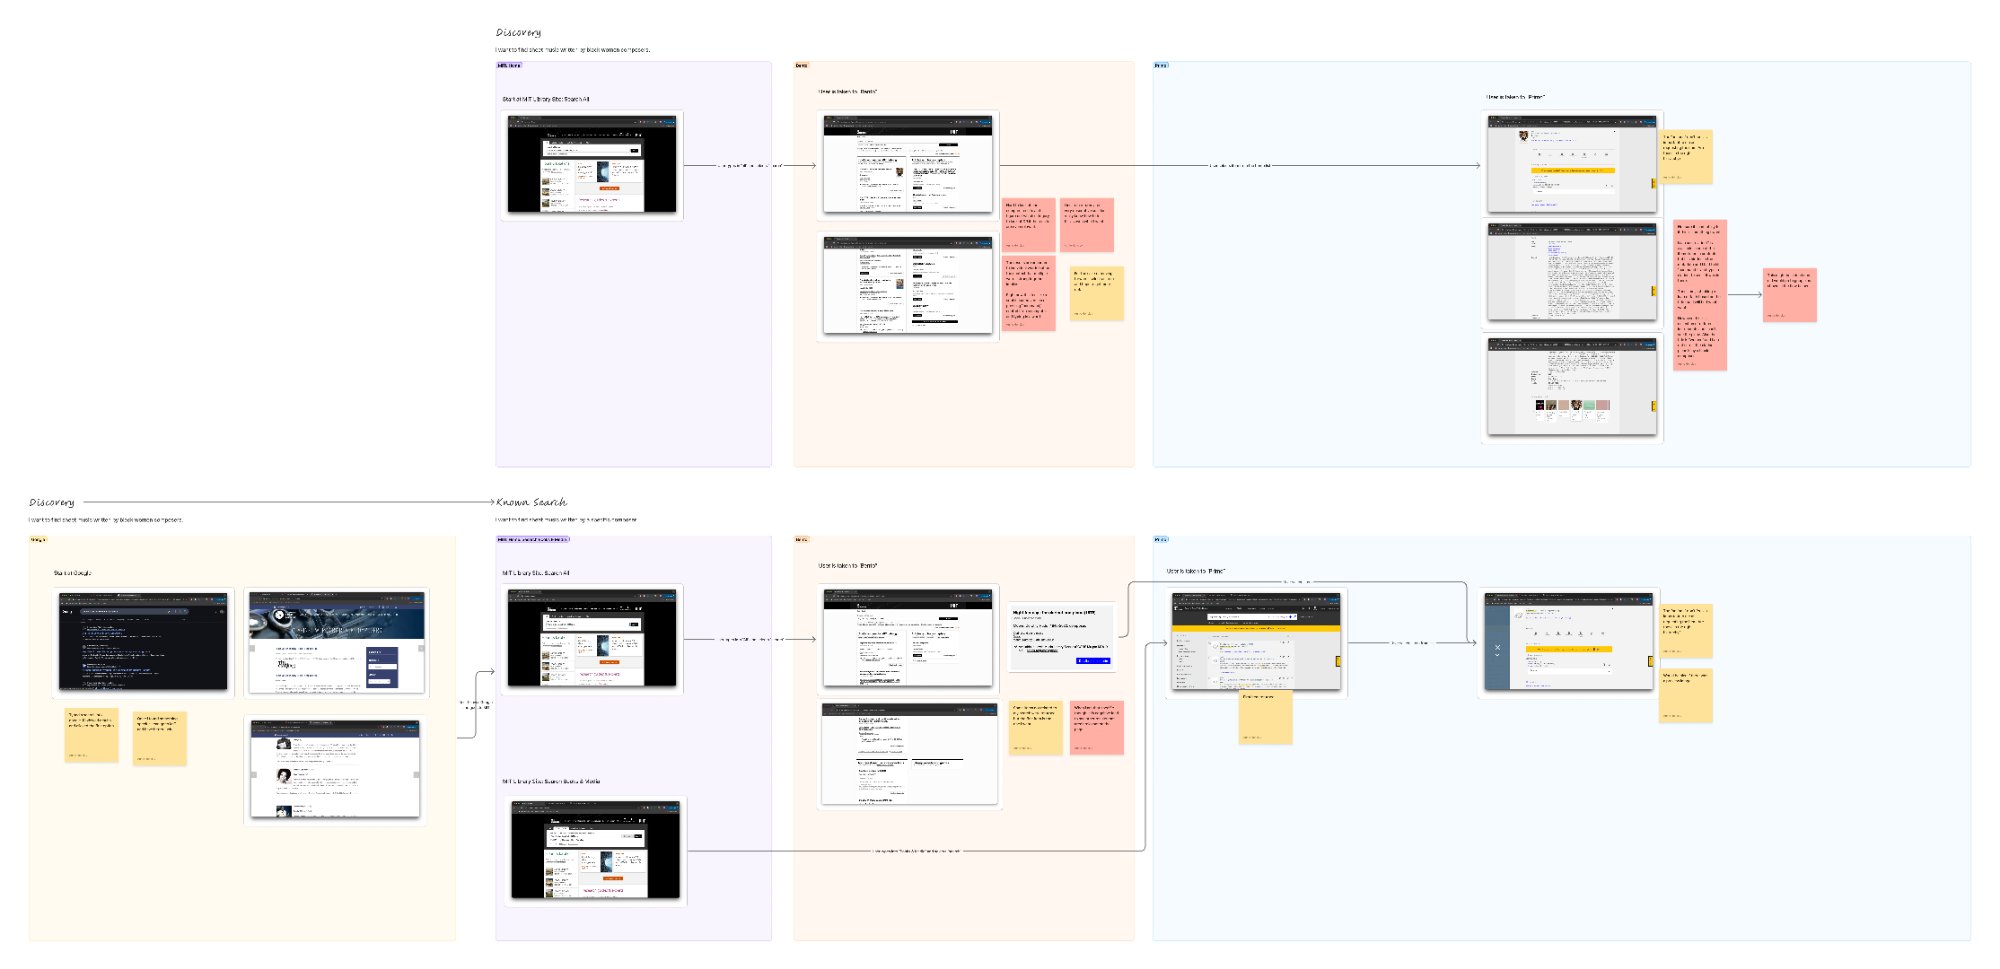
With strategic questions identified, we needed to map them to specific points in the user experience where measurement could provide answers. We held digital workshops with key stakeholders, mapping how users navigated through MIT Library's discovery ecosystem across their various tools. This journey became the scaffold for all of our metrics because it was intuitive and reflected actual user experience.
Digital workshop output: mapping how users navigate MIT Library's discovery ecosystem across Bento, Primo, ArchivesSpace, and other tools
Phase 3: Drafting the Framework
After mapping the various systems, our team took a look at the big picture to understand where processes overlapped, felt similar, or still had gaps in the data. The MIT Library team was full of experts, and our job was to bring everyone together and guide the team toward a final vision.
Creating Diagnostic Clusters
Through this collaborative process, our team organized all of the metrics each team was able to collect into 9 diagnostic clusters, which are groups of related signals that together could tell a complete story about where and why discovery breaks down. Ultimately, each cluster answered four questions:
Where is the problem?
Why is it happening?
For whom?
What now?
Diagnostic clusters are important because single metrics rarely tell the full story. For example, “low click-through rate” could mean poor ranking, broken links, or perfectly successful one-click access. But when bundled with resolver friction, authentication hotspots, and time-to-content, we can start to diagnose if the problem is metadata, infrastructure, or UI clarity.
Cluster 1A
Can users successfully retrieve known items without friction?
Cluster 1B
Do underlying issues silently degrade the user experience?
Cluster 1C
When users can't find what we already have, is metadata the reason?
Quick Wins
Partial signals that we can implement now but will tell us more as our data collection matures
Cluster 2A
Where are searches silently failing or degrading user trust?
Cluster 2B
Do users interact with search guidance — and does it help?
Cluster 2C
What happens when discovery fails — do users recover or give up?
Cluster 3A
Are users exploring deeply and returning over time — or just checking a box?
Cluster 3B
Are MITL's distinctive offerings visible, valuable, and used?
The 9 diagnostic clusters — groups of related signals that tell a complete story about where and why discovery breaks down
Cluster 1ACan users successfully retrieve known items without friction?
Metric
What it Measures
Signal
Interpretation
Relevance and Connection
Do search results lead to meaningful clicks and access (especially from the first page)?
Good / Adequate / Poor
If poor, review metadata quality, search ranking logic, and landing page clarity
Expectation Match
Do results fulfill what users thought they'd get based on search terms?
Good / Adequate / Poor
Low match rates suggest UI ambiguity or poor metadata surfacing
Known-Item Fulfillment
Do known-item searches result in successful access/export?
Good / Adequate / Poor
If poor, troubleshoot resolver flow, metadata alignment, and OA labeling
Click-Path Length
How many steps from search to content?
Short / Medium / Long
Long paths may signal UI friction or disjointed tool transitions
Effort to Fulfillment
Combine clicks + time to retrieve content
Low / Moderate / High
High effort = barrier; optimize for speed and clarity
Resolver Friction Points
Where users drop during link resolver flow
Few / Some / Many
High drop-offs point to dead links, broken hand-offs, or duplicate links
Authentication Hotspots
Where authentication points are most associated with user drop-off or session end
Minimal / Moderate / High
If high, look at EZProxy issues, expired sessions, or unclear UI affordances
Users saw what they expected — but didn't get what they needed
Cluster 1A: metrics, signals, and interpretation guidance for known-item retrieval friction
Phase 4: Refining with the Implementation Teams
In technical workshops, we worked with MIT's analytics and IT teams to stress-test every metric for feasibility, ensuring MIT could actually capture what we were proposing.
Acknowledging Technical Constraints
These sessions revealed critical constraints: some systems couldn't be instrumented easily, certain data required privacy considerations, and vendor platforms had limited visibility. Rather than compromise strategic value, we structured the framework with a three-tier priority system:
Priority 1: Answer Now — High-impact metrics MIT could implement immediately with existing analytics infrastructure.
Priority 2: Answer Soon — Metrics requiring modest technical investment or process adjustments.
Priority 3: Answer Later — Longer-term metrics requiring significant infrastructure shifts or broader organizational coordination.
We also developed Segmentation Lenses (User Role, User Intent, Entry Channel, Search Input Style) to ensure interpretation accounts for who's experiencing what and why it matters.
Phase 5: Deliverables and Documentation
In order to succeed, we needed to leave the team with clear documentation and implementation guidance that they could use over time, once our engagement with them had ended. We delivered a team-wide presentation and detailed documentation complete with:
Purpose Anchors explaining WHY each metric mattered, grounding it in strategic goals
Specifications detailing which logs to query, events to tag, and how to look at data across systems
Signal bands helping teams understand what patterns to look for and interpret results
Known gaps and edge cases where technical constraints created blind spots
Measurable Impact & Outcomes
Organizational Impact
Transformed 40+ user interviews and behavioral data from static research into actionable strategy
Created shared vocabulary and decision-making scaffolding across previously siloed teams
Delivered an implementation roadmap enabling immediate action while building toward the future
Established clear connections between metrics and strategic decisions, giving stakeholders confidence
Research & Strategic Impact
Built framework collaboratively, ensuring it reflected MIT's real constraints and strategic priorities
Balanced technical feasibility with strategic value, acknowledging what could be measured now vs later
Co-created with stakeholders, building genuine organizational ownership
Delivered comprehensive documentation enabling teams to implement and adapt confidently
“We were impressed with the depth and strategy of this plan—and equally impressed with how you learned to speak the language of libraries.”
— MIT Libraries Project Sponsor Stakeholder
Major EdTech Publisher
Redesigning Course Setup to Support Instructors' Pedagogical Goals
Instructors found the course creation process confusing and difficult, often requiring hands-on help from customer support specialists to get started. Our client had tried to fix their course creation experience multiple times, but each overhaul failed to solve the underlying problems. I led a comprehensive research and design initiative that transformed course creation from a barrier to adoption into a clear, instructor-driven experience. This work also established a new model for how our client approaches product development, shifting the organization toward continuous research and incremental improvement.
6
Previously siloed teams aligned around shared vocabulary and vision
3
Implementation slices that built toward a long-term strategic vision
1
New way of working defined for our client based on this work
The Challenge
The Problem
Instructors struggled with course creation and often needed customer support specialists to help them get started, creating a barrier to adoption. Courses ship with far more content than any instructor needs, the default order follows the textbook rather than the instructor's teaching sequence, and orienting to everything they were given took a lot of cognitive load.
The Complexity
Previous solutions treated courses like file organization, not learning experiences. Past designs focused on UX mechanics (i.e. moving items between lists, organizing folders) without considering how instructors think about learning objectives, assessment strategy, or how activities build on each other. Additionally, years of research existed but stakeholders had never aligned across silos. Product, Learning Science, Sales, and Assessment teams had different interpretations of the problem, different definitions of where Course Setup started and ended, and different vocabulary for the same concepts.
My Role & Approach
I served as Director and Lead UX Researcher, managing a team of researchers and designers through this multi-phase initiative.
What this required
Aligning previously siloed stakeholders around shared vision through structured workshops that created common vocabulary and understanding
Balancing business goals, UX goals, and pedagogical goals by shifting from moving content between lists to helping instructors scaffold learning experiences
Creating measurement systems to systematically evaluate each design against instructor needs identified through years of research, ensuring only concepts that met those goals went into testing
Evaluating concepts along the way through rapid testing, remixing, and validation cycles
Guiding the team toward building in slices rather than overhauls, defining implementation phases that could ship incrementally while building toward a larger vision
Phase 1: Strategic Alignment and Mapping Workshop
Before designing anything, we needed stakeholders speaking the same language. I brought together Product, Learning Science, Sales, Assessment, and Design teams that had never formally discussed Course Setup as a group.
Getting Everyone on the Same Page
I had each stakeholder group articulate where they thought Course Setup started and ended. Product thought it started with textbook selection. Sales thought it started with the demo. Learning Science thought it began with defining learning objectives. We mapped the complete journey together, from the instructor's first awareness through inviting students into a ready course, creating shared vocabulary and identifying knowledge gaps to explore through research.
Building on What We Already Knew
Our client had years of foundational research, but no one had synthesized it in one place. I facilitated sessions mapping existing research findings onto our newly aligned journey framework. This revealed patterns invisible when research lived in separate reports owned by different teams and showed us where we could move forward confidently versus where we needed deeper exploration. This mapping became the shared foundation for all subsequent design decisions.
Complete course setup journey mapped from the instructor's first awareness through inviting students into a ready course
Phase 2: Concept Testing & Rapid Iteration
With alignment established and knowledge gaps identified, we moved into rapid concept generation and testing. I designed a multi-wave process that would help us learn what worked before committing to any single direction.
Widely Exploring the Solution Space
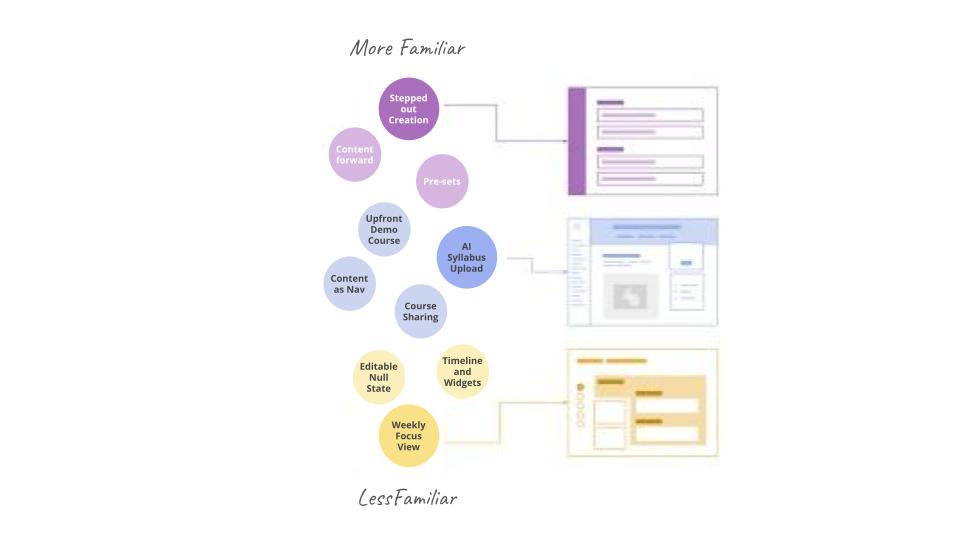
We generated concepts ranging from familiar to radically different, testing everything from automated rule-creation to AI-powered syllabus upload. The goal wasn't to pick a winner but to understand what elements resonated with instructors and why. The syllabus upload concept stood out because it addressed the efficiency and control tension directly — rather than asking instructors to browse an unfamiliar content library, it read their syllabus and surfaced relevant content in the order that matched their teaching intent. Instructors responded to seeing their own goals reflected back as a starting point rather than having to translate between their plan and the platform.
Key tensions emerged: instructors wanted efficiency but also control. They appreciated automation but needed transparency about what the system was doing. They valued guidance but also flexibility to work their own way.
Critical insight: Instructors needed to understand the pedagogical purpose of content, not just see what was available. Previous interfaces showed lists of activities without explaining why certain activities mattered or how they supported learning goals.
Phase 3: Remixing & Pedagogical Framing
Testing revealed what worked in isolation. The next step was combining successful elements and adding the pedagogical layer that previous designs had always missed.
Combining Strengths, Adding Purpose
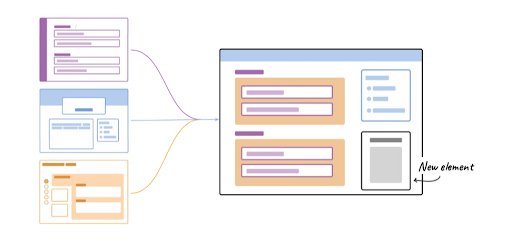
Testing revealed that instructors approached course setup in fundamentally different ways. Some wanted to explore, understand the content available to them, and make deliberate choices — for them, we improved the step-through flow, adding a pedagogical framing layer (Learn, Practice, Prove) so each decision felt purposeful rather than mechanical. Our Activity Preview remix didn't just show instructors what activities were available; it framed them by their pedagogical role so instructors could understand why certain content mattered for student learning, with interactive previews and expert recommendations that built confidence in choices.
Others already knew what they wanted to teach and found the exploratory path friction. For them, the AI Syllabus Assistant became the entry point: upload your syllabus, receive a recommended content set in your preferred teaching order, then review and adjust rather than build from scratch. The two paths shared the same underlying architecture — the difference was where you started.
Activity Preview remix: framing activities by pedagogical role (Learn, Practice, Prove) so instructors could understand why content mattered for student learning
Phase 4: Validation & Strategic Implementation
Validating the Complete Experience
I designed moderated sessions with instructors who had and hadn't recently adopted Achieve. This mix ensured we captured both fresh perspectives and experiences from those actively making decisions. The validation confirmed our approach worked. Instructors completed the setup process, understood their next steps, and preferred the new experience over the current state. More importantly, they understood the pedagogical purpose of the content they were selecting.
Building in Slices, Not Betting on Overhauls
The AI Syllabus Assistant launched first as a beta — a fast-track entry point that let instructors get into their course immediately and gave us early signal on what they actually needed from the experience. Separately, we defined three implementation slices to build out the full stepped flow: an MVP that addressed the most critical setup gaps, then successive layers that added the pedagogical framing and guidance that the more exploratory path required.
Measurable Impact & Outcomes
Organizational Impact
Established a new working model for product development for our client, shifting to a model of continuous research and incremental improvement
Aligned previously siloed teams (Product, Design, Learning Science, Assessment, Sales, AI) around shared understanding of user needs
Created shared language and mental models across the organization for talking about course creation
Positioned UX research as the hub connecting multiple parallel initiatives (Course Setup, LMS integration, assessment strategy, AI features)
Research & Strategic Impact
Defined 3 implementation slices that could deliver value independently while building toward larger vision
Created framework for incremental wins instead of betting on another complete overhaul
Enabled measurement and learning between slices rather than discovering problems only after full launch
Addressed the root cause that Course Setup had previously failed (instructors didn't understand what was in their course or have control over it), rather than symptoms or siloed parts of the process
Openfield — Internal Project
Creating Career Development Pathways that Scale
Openfield's job titles (Associate, Senior, Lead) lacked clear progression criteria. Generic annual reviews couldn't distinguish senior-level design craft from leadership readiness, leaving team members without an understanding of what it would take to reach the next level. Together with the Director of UX Design, I co-created the Pathways framework defining five developmental levels across four competency dimensions with discipline-specific behavioral indicators. This resulted in higher levels of team member engagement, increased tenure, more productive 1:1 conversations, clearer goal setting, faster upskilling, and transparent promotions.
3/3
Senior/Lead roles promoted from associate over 4–5 years
5
Developmental levels spanning 3 job titles, showing growth within roles
4
Competency dimensions designed around hard and soft skills
The Challenge
The Problem
Beyond unclear job progression, our company lacked a systematic way to develop talent. Managers could see gaps in team members' skills but had no framework to prioritize which gaps to address first or how to actively create development opportunities.
The Complexity
Openfield's business model relied on developing early-career talent into client-ready professionals, making talent development critical to success. Without clear guidance, development goals drifted toward what seemed interesting rather than what client work or business needs required. The framework needed to align individual growth with the capabilities clients and projects demanded.
My Role & Approach
I co-created the Pathways framework with our Director of UX design. This partnership was critical because the framework needed to work consistently across research and design disciplines while respecting their differences.
What this required
Making growth visible by creating a framework that showed people where they were in their development and what came next
Defining levels that acknowledged significant growth within a single job title, not just promotions
Co-creating with the team rather than imposing a framework, ensuring it reflected actual growth patterns and built genuine buy-in
Designing for integration with existing processes (1:1s, reviews, etc.)
Ensuring consistency across disciplines in how we approached management, feedback, and operational use
Early Career
Experienced
Emerging Leader
Leader
Seasoned Leader
Craft
Design Craft
UX/UI Design
😊
Design Documentation
😊
Research Craft
Research Documentation
😊
Research Methods & Planning
😊
Research Skills
😊
😊 indicates current self-assessed level for each competency
Phase 1: Defining the Structure
Before writing any competencies, we needed to define the framework's architecture. This structure had to accommodate different disciplines, acknowledge growth within roles, and provide clear progression.
Creating Developmental Levels
We defined five developmental levels that span three job titles: Early Career, Experienced, Emerging Leader, Leader, and Seasoned Leader. This structure acknowledges a critical reality: someone can be a Senior UX Designer for years while moving from Experienced to Emerging Leader to Leader within that role. Growth isn't just about title changes.
Early Career
Experienced
Emerging Leader
Leader
Seasoned Leader
Focused on building your craft, deepening your knowledge of the product development process, and working on features with significant oversight from a more senior teammate.
Focused on growing your craft and starting to take on responsibility for your team. Building your collaboration and communication skills and often working quite closely with more senior teammates.
Still investing in craft and collaboration skills, and starting to be able to grow those skills in others. Trusted to lead your own projects for your team with little oversight, and beginning to have an impact on the larger team.
An exemplar of craft and collaboration; someone other designers/writers seek out and learn from. You guide work for significant initiatives, and handle complex projects with overlapping organizational lines. Starting to show impact in the larger team.
A craftsperson of the highest level; you guide, direct, and approve work of teammates. Trusted to lead the largest and highest impact projects to the business, often with significant complexity. You're a leader at Openfield, and in the industry.
Identifying Competency Dimensions
We organized the framework around four competency dimensions that apply across disciplines:
Craft & Execution: Discipline-specific skills (UX/UI design methodologies or research methodologies)
Collaboration & Communication: Stakeholder management, presentation skills, team dynamics
Strategic Thinking: Problem-framing, systems thinking, business impact
Leadership & Influence: Mentorship, thought leadership, organizational impact
These dimensions gave us a way to talk about different aspects of someone's development. You might be at "Emerging Leader" in craft while still at "Experienced" in strategic thinking, and that's normal and valuable to name.
Phase 2: Defining the Behavioral Indicators
With structure defined, we needed to write specific, observable behaviors for each level within each dimension. To do this, we collected and mapped various annual review documents, job descriptions, goals, and other documents so that we could see all the feedback across the team in one place.
Making Language Specific and Actionable
As we tested various iterations of this framework, we learned that generic language like "strong communication" is meaningless because it could describe anyone. We needed behavioral indicators specific enough that people could recognize themselves and know what to develop next.
For example, in Process & Methodology (a Craft & Execution indicator):
Early Career: "You follow the OFX process internally and in client projects"
Experienced: "You advocate for the process with external client teams"
Emerging Leader: "You help foster and evolve areas needing improvement"
Leader: "You drive process improvements, adapting to different client contexts"
Seasoned Leader: "You influence processes at team level, delegate well"
Each level builds on the previous one. You can't advocate for the process externally until you've internalized it. You can't evolve it until you've seen it work across contexts.
Behavioral Indicators Across Dimensions
The following shows how growth expectations evolve across the five developmental levels within three of the four competency dimensions.
Collaboration & Communication
Working with Clients
Early Career
Experienced
Emerging Leader
Leader
Seasoned Leader
Listen to project needs; work with lead to respond with next steps
Participate regularly in team-level conversations
Responsive and proactive across all channels
Presentations have clear narrative and good context setting
Proficient at managing stakeholders; work without close oversight
Know when and how to tactfully advocate for quality
Actively guide client conversations so they don't need to check in constantly
Coach others on communicating research insights
Build bridges between research insights and business objectives
Facilitate collaborative sessions that build shared understanding
Lead meetings effectively; represent Openfield well externally
Establish and maintain strong research–team partnerships
Strong storyteller; influence and persuade at any level
Model for stakeholder management, including executive involvement
Manage feedback from multiple sources; recommend a path forward
De-escalate conflict; resolve difficult blockers
Broker agreement among competing stakeholder priorities
Serve as confidant and advocate for high-level client leaders
Give actionable feedback in collaboration sessions and quarterly reviews
Routinely help teammates grow through feedback or learning initiatives
Offer suggestions on how output and processes can improve; help implement solutions
Level up teammates' skills through formal coaching and mentorship
Drive initiatives that improve team workflows and the lives of designers and researchers
Lead by example; never hesitate to get your hands dirty
Comfortable in undefined situations; help your team feel like they know what to do
A leader at Openfield with impact on business and culture across the organization
Level up teammates' leadership skills; build more UX leaders
Impact & Effectiveness: behavioral indicators across five developmental levels
Phase 3: Piloting and Refining
Testing with Real Conversations
I used the framework in my own 1:1s and peer reviews, paying attention to which indicators helped people understand their development and which ones created confusion. When something didn't land, we revised it.
Refining Based on Feedback
The pilot revealed places where indicators were too vague or where we'd missed important aspects of growth. For instance, our initial Strategic Thinking indicators focused heavily on business impact but didn't capture systems thinking well. We added more specific language about seeing patterns, understanding interdependencies, and anticipating downstream effects.
Phase 4: Operational Integration
Creating Self-Assessment Cycles
We started having each team member evaluate themselves against the pathways at least annually, sometimes twice a year. Evaluations were done blindly first, then discussed in 1:1s. This approach surfaced gaps in perception and created more honest conversations about development.
Streamlining Annual Reviews
The annual review process became streamlined around the pathways documentation. Instead of writing lengthy reviews, we focused on how much progress each team member made over the year and where they were headed next. The pathways provided the structure, so reviews became synthesis rather than assessment from scratch.
Focusing Goal-Setting
Annual goal writing became more focused on what gaps people wanted to prioritize on their pathway. Instead of vague goals like "improve presentation skills," goals became specific: "Reach Emerging Leader in Collaboration by presenting research findings to non-research client audiences." Tracking became easier because goals were integrated into bi-weekly 1:1 conversations rather than reviewed once a year.
Extending Beyond Performance
The pathways became part of hiring conversations when evaluating potential new fits for the team. We could describe what Early Career or Experienced looked like in each dimension, helping candidates understand what success meant at Openfield and helping us assess whether someone's skills and ambitions aligned with our needs.
Measurable Impact & Outcomes
Organizational Impact
Achieved company-wide adoption
Created transparent promotion criteria for team members and coaching tools for managers
Optimized team resourcing around individual goals tied to career advancement
Increased strategic goal setting
Fostered self-directed development
Replaced annual review surprises with quarterly synthesis based on ongoing conversations
Promoted targeted, actionable feedback
Enhanced the hiring process
“[Researcher on my team] started as an associate with you around the same time I hired [Researcher on my client's team], but she seems to have grown so much faster. Manager-to-manager, what are you doing to support her?”
— Client Manager of a UXR Team that we regularly work with
Macmillan Learning — Major EdTech Publisher
Integrating AI into Product Development to Accelerate Discovery
Our client's product development lifecycle took multiple quarters to move a single idea from problem validation through solution validation. As the team searched for their next revenue-generating product, they needed to explore multiple opportunities simultaneously while maintaining confidence. I co-led the design of an AI-accelerated framework with a researcher on my team, transforming their process to validate 5–6 concepts in parallel in 9 weeks instead of one idea per quarter.
2–3×
Faster at every stage, leveraging defined processes with AI and automations
5–6
Concepts validated in parallel vs. 1 concept sequentially
6–9 wks
From problem to solution validation
The Challenge
The Problem
Our client had a company-wide goal to integrate and test AI across their product development process, but teams were experimenting with AI tools in disconnected ways. There was no cohesive strategy for how AI should fit into the process, and no way to ensure these tools were improving decision quality, not just speed.
The Complexity
The framework needed to balance speed with rigor while serving multiple use cases. Teams needed to validate whether problems were real, whether solutions resonated, and whether people would pay. Additionally, as external contractors, we needed to build processes that product managers and researchers could run independently without requiring specialized AI expertise or ongoing consultant support.
My Role & Approach
I co-led the framework design with a quant-focused researcher, representing UX to design, product, and operations stakeholders. My approach focused on integrating AI as a multiplier for human thinking, not a replacement.
What this required
Defining standardized end-to-end processes that created efficiencies independent of AI, while strategically integrating AI tools where they added value
Using AI to increase consistency, scalability, and team confidence, not just speed
Establishing rapid online recruitment workflows to quickly access diverse user audiences for validation
Expanding UX research beyond 'does this problem exist?' to business-critical questions for an AI-enabled world: 'would people pay to solve this when AI tools provide free solutions to students?'
Building validation gates to kill bad ideas faster so teams could focus resources on the most promising opportunities
Creating sustainable processes that product managers and researchers could run independently
Process Overview
Two views into the process: a full research workflow showing exactly where AI fits in, and the Expanse gate framework built for fast parallel validation.
Human-led
AI-assisted
Step 1 — Human
Collaborate with the team to understand research and generative goals.
AI Assist
Search for secondary research and academic work related to design or generative goals. AI surfaces evidence the team can evaluate — it does not generate the goals.
Step 2 — Human
Sharpen goals and create a research plan. Define research questions and map activities to each goal.
AI Assist
Check the research plan against the stated goals. Flag questions that stray from scope. Confirm all goals have coverage.
Step 3 — Human
Write the moderator guide. Fully human-authored.
Step 4 — Human
Run user interviews. Hand-written notes taken after each individual session. Key themes and overall sentiment tracked in a research journal.
Step 5 — AI Assist
Feed goals, research questions, and hand-taken notes and sentiments into AI. AI finds supporting evidence framed the way the human asked it, surfaces additional themes, and can map connections using NotebookLM.
Step 5 — AI Assist
AI fills in standardized report slides — methodology, participant tracking, and other boilerplate sections — freeing the researcher to focus on the insight narrative.
Output
Finished research report. Human-led insights, AI-accelerated synthesis and documentation.
AI acts as a multiplier, not an initiator. Every AI touchpoint is grounded in goals and notes the human has already established — the researcher drives intent, AI accelerates execution.
Human-led
AI-assisted
Automated
AI-assisted + Automated
Problem Validation
Gate 1Is the problem clear?
AI-assistedAsync
Human
Problem owner writes the initial problem statement from research findings and ultimately presents it to the team.
AI
A Claude Skill refines the statement into a consistent format — person, context, consequence — so all problems across the program are evaluated on the same terms. The Skill asks the problem owner clarifying questions to get to the heart of the problem.
Gate 2Is the problem real and painful for users?
AutomatedAsync
Process
The survey is templatized based on team needs. The survey-ready problem statement from Gate 1 drops directly in. An R script runs on responses and automatically generates a synthesis report.
AI
A Claude Skill delivers a structured briefing from the report and asks the product owner and researcher questions to develop a shared point of view before the go/no-go decision. AI surfaces the evidence; humans make the call together.
Gate 3Is it a problem we should solve?
AI-assistedAutomatedSynchronous
Human
Full team discussion, strategic assessment, and risk review. The only synchronous gate in problem validation — intentionally placed as the transition point from problem work to solution work. The whole team makes the go/no-go decision together.
AI
Can surface past initiatives that addressed similar problems, pulled from a Confluence knowledge base being built out for this purpose.
Solution Validation
Gate 4Do our initial solutions resonate?
AI-assistedAsync
Human
Product team leads ideation and builds rough prototypes. A designer reviews for cognitive load. UXR assesses whether the prototype is actually testing what it needs to show — not AI slop, not too much in front of the user at once.
AI
Veo generates a concept video demo of the problem and solution. This video is shown to participants in Gate 5 to validate the concept before any full build happens.
Gate 5Do we have the winning solution?
AutomatedAsync
Process
Quantitative concept test. Participants view the Veo concept video before responding — they're validating a real concept, not a static written description. Same automated pipeline as Gate 2.
AI
R script generates the synthesis report. Claude Skill briefs the team and facilitates alignment toward a decision.
Gate 6Is the winner ready for early development?
AI-assistedSynchronous
Human
Final usability testing follows the same pattern as the full research process — moderated sessions with hand-taken notes. Second and final synchronous moment: the team aligns on evidence before development handoff.
AI
AI-assisted synthesis following the same pattern as Step 5 in the full research process.
Expanse is async-first by design. Synchronous meetings only happen at Gates 3 and 6 — the two transition points where the whole team needs to align before moving to the next phase. AI accelerates every other gate, but humans make every decision.
Phase 1: Framework Development
We had two weeks to design a framework that would take hypothesized problem statements through validation, prioritization, and solution validation. This meant defining gates, identifying where AI could add value, and stress-testing our logic.
Whiteboarding the Gate Structure
We started by mapping the traditional product development lifecycle and identifying bottlenecks. We designed six gates that built on each other, each with a specific question to answer:
Gate 1: Is the problem clear? (Problem statement clarity and evidence)
Gate 2: Is the problem real and painful? (Quantitative validation of reach and impact)
Gate 3: Should we solve it? (Strategic fit and go/no-go decision)
Gate 4: Do our solutions resonate? (Qualitative concept testing)
Gate 5: Do we have the winning solution? (Quantitative concept validation)
Gate 6: Is the winner ready for development? (Usability testing and handoff preparation)
Identifying AI Integration Points & Automations
For each gate, we identified where AI could improve consistency, scale, or speed without compromising decision quality. We experimented with prompts and tested tools, working within the client's legal constraints of approved AI platforms. Some integrations were obvious: AI could draft problem statements to fit a specific format faster than humans. Others required more thought: AI could score problem statement clarity, but humans needed to validate the scoring logic made sense. We also determined that some steps were better suited for more predictable methods, like survey automations using R scripts.
Defining Pass/Fail Criteria
Each gate needed clear criteria for what passed and what failed. This was critical because the goal was to kill bad ideas early, not move everything forward. We defined scoring rubrics based on reach, impact, opportunity gap, and strategic alignment so teams could compare opportunities objectively rather than relying on gut instinct or whoever advocated loudest.
Phase 2: In-Person Alignment and Refinement
We traveled to an in-person alignment meeting, expecting to explore additional opportunities to integrate AI, but the discussion quickly centered around our framework and how we might move forward implementing it.
Aligning Across Design, Product, and Operations
The in-person meeting brought together design, product, and operations stakeholders who had never aligned on a shared development process before. We walked through each gate, explaining the logic, the AI integrations, and the pass/fail criteria. The framework was adopted.
Refining Based on Stakeholder Input
Through discussion, we refined aspects to fit our client's specific context. We identified which existing tools could be leveraged and where new infrastructure was needed. We aligned on who would own each gate and how decisions would be documented.
Planning the Stress Test
We left the in-person meeting with a plan to stress test the framework for a quarter, running real product ideas through all six gates to see what worked and what needed adjustment.
Phase 3: Building the Infrastructure
Creating Automations and Scripts
We worked with Product Operations to build Zapier automations that would route ideas through gates and trigger workflows. The researcher on my team built R scripts for analyzing survey data and generating standardized reports. I organized the process and packaged it clearly so teams could execute independently and stakeholders could follow along.
Testing AI Tools and Prompts
We experimented with AI tools at each gate, working within the client's approved list. For problem statement drafting, we configured OpenAI API with consecutive prompts for refinement and scoring. For concept development, we tested rapid prototyping tools.
Designing for Sustainability
Every piece of infrastructure needed to be something teams could maintain after we left. This meant clear documentation, standardized templates, and processes that didn't require specialized expertise to run. We even created a templatized Decision Packet for tracking all the problem statements and gates, in case we decided to pivot away from one idea but pick it up later.
Phase 4: Stress Testing & Integration
We ran two problem batteries through the complete process, from problem validation to solution validation. Out of the initial set, we narrowed to the most promising opportunities based on reach, impact, and opportunity gap scores. Then we explored 5–6 solution concepts for the top problem, validating which resonated most strongly.
Recruiting Extended the Process
Recruiting challenges pushed the timeline to 9 weeks. Even at 9 weeks, this was dramatically faster than the previous multi-quarter timeline, and we validated multiple concepts in parallel rather than one at a time.
Results Were Messier Than Expected
Survey data showed many problems scoring similarly, making prioritization difficult. We introduced max diff surveys where participants had to pick the top and bottom problems to solve, forcing clearer priorities. We adjusted scoring thresholds based on what actually distinguished good opportunities from mediocre ones.
AI Tools Still Needed Design Oversight
Product managers tried using AI to build prototypes without designer involvement, but this created problems. The prototypes were functional but full of cognitive load, distracting buttons, and unclear priorities. A design eye was still needed to ensure prototypes solved the right problem in the right way. We adjusted the process to require designer checkpoints before concepts went to validation.
Measurable Impact & Outcomes
Organizational Impact
Reduced time from problem validation to solution validation from multiple quarters to 9 weeks
Enabled parallel exploration of 5–6 concepts per quarter instead of sequential evaluation of single ideas
Created standardized scoring and evidence packets that replaced gut-call decisions with measurable signals
Built sustainable infrastructure that teams could execute independently without external consultants
Achieved 2–3× speed improvements at every stage through thoughtful AI integration: problem statement drafting, survey analysis, concept prototyping, and documentation
Research & Strategic Impact
Evolved UX research focus from "does this problem exist?" to "would people pay to solve this?", addressing real market viability rather than just user needs
Identified confident solutions to pursue for our client's next revenue-generating product along with clear directions to abandon
Macmillan Learning — Major EdTech Publisher
Building a Research Democratization Program That Scaled Itself
Macmillan Learning's UX research team could not keep up with demand. Without enough researchers to serve every team, product managers, editorial staff, and designers were conducting their own studies without methodology training or oversight, often reaching conclusions that gave teams false confidence in unvalidated decisions. I designed a democratization program to meet teams where they were, giving them the tools, training, and governance to do certain types of research well. Two years in, the program runs on less than 10% of my time, sustained by an internal group of champions who have made it their own.
8
Research templates covering the most common validated study types
2 yrs
Program running with growing team independence
5×
Reduction in researcher time to sustain it, from 40–50% in year one to under 10% today
The Challenge
The Problem
Research demand consistently outpaced capacity. With too few UX researchers to serve every team, colleagues across product, editorial, and design were running their own studies without methodology training or bias awareness. The result was research that gave teams false confidence in decisions that had not actually been validated.
The Complexity
Teams had real research needs and were going to act on them with or without support. The challenge was designing a program rigorous enough to improve quality without being so burdensome that teams bypassed it entirely. It also needed to work across very different audiences: editorial teams thinking about content, product managers focused on roadmaps, and designers closest to the UX practice.
My Role & Approach
I designed, launched, and scaled the democratization program from the ground up at Macmillan Learning, drawing on a parallel program I had built internally at Openfield to develop research skills across our own blended research and design team.
What this required
Auditing historical research requests to identify which study types repeated most and were best suited for democratization
Interviewing stakeholders across editorial, product, and design to understand their needs, comfort levels, and past research experience
Building a governance framework teams could use to self-evaluate whether their project was a good candidate before submitting a request
Designing templates bias-aware enough to be run without a researcher present, while still producing reliable data
Creating training focused not just on how to use the templates, but on when research is and is not appropriate
Setting up coaching structures so teams had ongoing support without creating dependency on the UXR team
Designing for graduation: building the program so it could be owned and driven by internal champions over time
Phase 1: Discovery and Needs Assessment
Auditing Existing Research Requests
I reviewed the research requests I had received across the engagement to identify patterns. Certain study types appeared repeatedly: concept validation, usability testing, survey-based feedback collection. These became the foundation for the template library, not because they were simple, but because they were bounded enough that a well-designed template could hold the methodological rigor in place. I used NotebookLM to synthesize patterns across the archive — its source-tracking kept every identified pattern traceable back to a specific request rather than treated as a general impression.
Stakeholder Interviews Across Teams
I interviewed stakeholders across editorial, product, and design to understand their experience with research. What questions were they trying to answer? What had they tried on their own? Where had they gotten stuck? These conversations revealed that teams were not trying to bypass UX research. They were trying to move at the speed their roadmaps demanded. The program needed to meet them there.
Phase 2: Governance Framework and Template Development
The hardest design problem was not the templates. It was governance. Without a clear decision framework, teams would either bring everything to the program or bypass it entirely.
The PAIR Framework
I created the PAIR Framework to help teams self-evaluate whether a project was a good candidate for democratization before submitting a request. Projects that scored low across all four dimensions could move forward with a template. Higher-stakes projects required closer partnership with the UXR team.
P
Problem complexity
Low = good candidate
A
Amount of risk
Low = good candidate
I
Impact on strategy
Low = good candidate
R
Reach
Low = good candidate
The same logic extends to AI. PAIR isn't just a gatekeeping tool for who runs a study — it's the same framework I apply when deciding how much to trust AI in the synthesis layer. Low-PAIR projects have short feedback loops and a low cost of error: AI synthesis is efficient and appropriate. High-PAIR projects — complex problems, real stakes, broad reach — call for a different standard: AI surfaces patterns as a first pass, but a researcher goes back to source data rather than relying on the synthesis alone. The risk-stratification logic transfers directly.
When to Democratize vs. When to Partner
Good to Democratize
Validating known problem statements
Testing specific design solutions
Low-reach efforts using established templates
Usability testing on defined prototypes
Partner with the UXR Team
Understanding emerging user needs
Researching complex problem spaces
High-impact or high-reach efforts
Studies that will inform major strategy
The Microsite and Initial Six Templates
To give teams a single destination for everything they needed, I built a microsite that housed the governance framework, all templates with direct links, the full process documentation, training resources, and FAQs. Having everything in one place was important: teams could self-serve at any point in the process without needing to track down documents or remember where things lived.
The microsite launched with six templates, each designed around a specific and recurring research goal. Questions were standardized to eliminate common biases, with clearly marked sections teams could customize for their specific project context.
Unmoderated · UserTesting.com
Student Concept Test
Evaluate how well your proposed high-level proof of concept aligns with student needs and identify opportunities for refinement and improvement.
Unmoderated · Qualtrics
Concept Survey
Gauge initial reactions to a new concept, its appeal compared to alternatives, and its perceived strengths and weaknesses.
Unmoderated · UserTesting.com
Task-based Usability Test
Assess prototype usability, task completion success, and design improvement opportunities.
Unmoderated · UserTesting.com
Student Activity Test
Evaluate clarity, engagement, and educational value of student activities through unmoderated testing.
Moderated
Red Box Problem + Solution Interview
Validate problem-solution fit and understand adoption barriers through a moderated interview guide.
Unmoderated · Qualtrics
Beta Test Feedback Survey
Evaluate how well your solution supports user needs and identify product-market fit after launch.
Internal Research Hub
Democratizing Research
Jump to Templates →
Democratizing Research
Templates, resources, and trainings to support your project needs
When to Democratize or Not?
Our templates enable you to conduct certain types of research independently, while more complex projects should partner with our UX Research team.
Good to Democratize
Validate known problem statements · Test specific design solutions · Low-reach efforts · Use our established research templates
Partner with the UXR Team
Understand emerging user needs · Research complex problem spaces · High impact / high reach efforts · Studies informing major strategy
PAIR Framework
Problem complexity · Amount of risk · Impact on strategy · Reach — when all score low, the project is a strong candidate for democratization
UX Research Templates
Each template is designed for specific research goals
Student Concept Test
UserTesting.com · Unmoderated
See Template →
Concept Survey
Qualtrics · Unmoderated
See Template →
Task-based Usability Test
UserTesting.com · Unmoderated
See Template →
Student Activity Test
UserTesting.com · Unmoderated
See Template →
Red Box Problem + Solution Interview
Moderated
See Template →
Beta Test Feedback Survey
Qualtrics · Unmoderated
See Template →
Democratized Research Process
1️⃣
Request Research
2️⃣
Project Kick-off
3️⃣
Pre-research Checkpoint
4️⃣
Post-research Checkpoint
The Democratizing Research microsite: a single destination housing governance guidance, all templates with direct links, the quality process, training resources, and FAQs
Planning Support: Beyond the Templates
Alongside the study templates, I created a suite of planning guides to help teams structure their research before they even opened a template: a Research Scope Guide for writing tight problem statements, an Audience Guide for defining recruiting criteria, an Unmoderated Test Guide for structuring task flows, and an Insights Compilation Guide for turning observations into findings. Together these tools meant teams had support at every stage of the process, not just the study design phase.
Planning Template
Research Scope Guide
Make a copy before use
Problem Statement
"We want to understand student expectations with regards to [study object]"
Tip: One verb phrase, one research noun, one study object. Declarative sentence only.
Research Objectives
Objective 1: Understand how students currently approach...
Objective 2: Identify the primary barriers to...
Target Audience
e.g. Undergraduate students enrolled in STEM courses at 4-year institutions, who have used the platform within the past 30 days
Fields shown in blue are customizable. All other sections remain standardized to maintain research rigor across studies.
Study Template
Activity Prototype Test Template
Make a copy before use
Use this template to evaluate a student activity in order to understand:
How clear the activity's instructions are to students
How engaging students find the activity
The learning value students perceive in the activity
The overall experience completing the activity
What students liked and disliked about the activity
How to use this template
Fields highlighted in blue are yours to customize. Everything else is standardized to maintain consistency and research validity across studies.
Task
Type
Goal / Rationale
Question / Task Text
Task 2
Navigation
Get students to the activity, as directly as possible
Imagine you are a student in [insert subject here]. Your teacher has shared this link with you: [insert URL here]. Please go ahead and open it.
Task 4
Orientation
Help students orient to the activity before diving in
Before you start, take a moment to look at this activity. It's about [brief description]. What do you notice first? What do you think you'll be doing?
Task 8
Multiple choice
Measure engagement (standardized)
How engaging did you find this activity? [Not at all engaging / Slightly engaging / Moderately engaging / Very engaging / Extremely engaging]
Task 12
Multiple choice
Measure perceived learning value (standardized)
How much do you feel you learned from this activity? [Nothing at all / A little / A moderate amount / A lot / A great deal]
Blue fields are customizable per study. Task types, rationale, and scale questions are standardized across all activity tests.
Phase 3: Training and Launch
Training Content
I designed a training program that addressed the two things that matter most in democratized research: knowing when to do it, and knowing how to do it well. Training covered why UX research matters, the cost of getting it wrong, how to apply the PAIR Framework, which study types to democratize versus escalate, and how to use each template and platform. I also created how-to videos for UserTesting.com covering reporting, the Insights Hub, pulling clips from videos, and building highlight reels.
AI-Assisted Survey Quality Check
Alongside training on the templates themselves, I built a Claude Skill specifically for non-researcher survey review. The skill flags double-barreled questions, identifies the most critical question in a study design, and checks that framing meets brand standards for consistent question language. This extended the program's quality coverage without adding researcher hours — teams could run an automated first-pass check on their study design before the pre-research checkpoint. My own review could then focus on higher-order questions: whether the survey was designed to answer the right question, whether the research goals were clear, the things that require context the tool doesn't have.
Bi-weekly Office Hours
I set up recurring office hours as a standing venue for teams to ask questions, pressure-test their research plans, or get quick feedback on findings. Open-ended by design, not a formal gate, just consistent availability that helped teams build confidence without creating bottlenecks.
Monitoring the Program and Refining Over Time
After launch I tracked which templates were being used most, what questions surfaced repeatedly in office hours, and where teams were requesting customizations beyond what the templates supported. This feedback loop was as important as the launch itself. When the same customization request appeared across multiple teams, it was a signal that a new template was needed rather than a one-off tweak. Recurring requests for standalone problem validation and solution testing, each scoped more narrowly than the Red Box Interview covered, led to the development of two additional moderated templates: a Problem Interview and a Solution Validation Interview. This expanded the library from its initial six to eight and ensured the program stayed aligned with how teams were actually working, not just how they were expected to work at launch.
Phase 4: Coaching, Checkpoints, and Handoff
Every study ran through a four-step process that built quality checkpoints in at the right moments, so rigor was not dependent on how carefully a team remembered their training.
1
Request Research
Submit via the UX Research Resource Request Form. If the project qualifies, you will be invited to a kickoff meeting and asked to complete the Research Intake Form.
2
Project Kickoff
Your research partner helps you choose the right template, understand your recruitment needs, and refine any sections specific to your project.
3
Pre-Research Checkpoint
After finalizing your plan or script, meet for a review. Once approved, your partner helps you run a pilot test or a practice interview before you launch.
4
Post-Research Checkpoint
Collaborate with your research partner before finalizing your report to ensure insights are clear, valid, and actionable. Reporting templates help structure the narrative.
Individualized Coaching
As teams ran their first studies, I joined interviews to offer real-time coaching, reviewed reports before they went to stakeholders, and helped teams build confidence in drawing valid conclusions from their data. Coaching was calibrated to each team's starting point: editorial teams needed more support with recruiting and question design, while product teams needed more guidance on synthesis and reporting.
Reporting Templates
I created reporting templates alongside each research template so teams could more easily communicate the narrative of their findings. These reduced the gap between data collected and insight actually shared, which had been a consistent weak point when teams ran research independently.
The reporting guidance also included a sequencing protocol for AI-assisted synthesis: team observations and notes are written up first, then AI synthesizes on top of that human record. This order matters. AI synthesizing before researchers have captured their own thinking risks pattern-matching on surface-level content a researcher would have contextualized differently given full knowledge of the study and the decisions it was informing. The protocol made AI a tool for amplifying human thinking rather than replacing it.
Measurable Impact & Outcomes
Organizational Impact
Increased research rigor across teams that had previously conducted unvetted, often biased research without any oversight or methodology guidance
Built cross-team relationships as the program brought product, editorial, and design into shared research conversations for the first time
Broke down research silos: the program created regular touchpoints for teams to share findings across groups that had previously worked in isolation
Gave UX researchers clearer focus on the highest-complexity, highest-stakes projects that genuinely required specialist expertise
Raised team-wide understanding of when research is appropriate, what it can and cannot answer, and how to commission it effectively
Research & Strategic Impact
Program began as a 40–50% time investment in year one and now runs on less than 10% of researcher time, sustained by an internal group of champions who have taken genuine ownership
Templates designed to hold methodological rigor in place through proven question structures, removing dependence on the expertise of the person running the study
PAIR Framework enables teams to self-qualify research candidates without needing a researcher in the room, shifting governance from gatekeeping to enablement
Reporting templates reduced friction between data collected and insight shared, increasing the likelihood that research actually influenced decisions
AI-assisted quality checks, embedded as a Claude Skill into the template workflow, extended quality coverage without adding researcher hours — teams could get an automated first-pass review of study design before the pre-research checkpoint
Major EdTech Publisher
Building a Competitive Usability Benchmarking Program That Shaped Product Strategy
Instructors using higher ed courseware spend hours inside complex workflows: setting up courses, managing assessments, interpreting student data. When those workflows create friction, instructors disengage, students miss support, and publishers lose ground to competitors. A major courseware publisher needed a rigorous way to measure where their product stood relative to the market, and a clear path from that measurement to real product decisions. As a consultant, I built and ran a PURE (Practical Usability Rating by Experts) benchmarking program from the ground up: designing the methodology, training and leading an expert evaluation team, and establishing the research infrastructure needed to run the analysis repeatably year over year. The program benchmarked 25 instructor workflows against two major competitors and gave the organization a shared language for UX quality, a competitive baseline to improve against, and a direct line from research findings to roadmap decisions.
25
Instructor tasks evaluated annually across 5 product verticals
62%
Green score, outpacing McGraw Hill Connect (40%) and Cengage MindTap (24%)
2
Years of YOY benchmarking; PURE framework embedded in design critique culture
Phase 1: Designing the Program
Choosing the Right Method
The organization needed a way to measure usability that was rigorous enough to stand up in front of executives, reproducible enough to run year over year, and specific enough to generate actionable product direction. Critically, it also needed to scale quickly without the logistics of scheduling user interviews, coordinating product access, and managing login credentials across 25 tasks in three competing platforms. We focused the evaluation on new users, specifically instructors setting up and navigating the product for the first time, the moment when friction is highest and the impression most lasting.
I selected PURE (Practical Usability Rating by Experts) as the methodology. PURE uses a structured expert panel to evaluate task-by-task usability on a 1-3 scale, producing quantitative scores grounded in qualitative rationale. It generates a total score that is comparable across products and trackable over time, which made it well-suited for both competitive benchmarking and YOY measurement.
The NNGroup Rotten Tomatoes analogy captures why expert evaluation works. Just as the Tomatometer aggregates professional critics' reviews to produce a reliable signal faster than waiting for full audience data, PURE aggregates expert UX evaluators' scores to produce a reliable usability signal faster than running full user studies. Expert judgment, properly calibrated, is a fast and valid proxy.
The Expert Evaluation Analogy
🍅
Tomatometer
94%
Expert film critics rate the movie. Their aggregate score signals quality reliably before the general audience ever sees it.
→
📊
PURE Score
62%
Expert UX evaluators rate each task step. Their aggregate score signals usability reliably without waiting for a full user study.
Analogy sourced from Nielsen Norman Group: "PURE: Pragmatic Usability Rating by Experts" (nngroup.com)
Defining What to Evaluate
I met with product teams across the organization to identify the most business-critical instructor workflows. We landed on 25 tasks spanning five areas: Ecommerce, Course Setup, Foundational Experience Maintenance, Assessment Maintenance, and Reporting. For each task, I mapped the happy path and defined precise step boundaries: a step begins when the system presents the user with a set of options and ends when the user takes an action expecting a significant system response. Defining these boundaries consistently was essential for scoring to be reliable across evaluators and years.
Adding a Competitive Dimension
Running the same 25 tasks against McGraw Hill Connect and Cengage MindTap transformed what could have been an internal audit into a competitive intelligence tool. The rationale was straightforward: if the business priority was winning takeover accounts as well as retaining existing ones, the research needed to map directly onto competitive position. Benchmarking against both major competitors gave the organization a way to answer that question with data rather than instinct, and made it possible to have productive conversations about where to compete versus where to focus on holding ground.
Phase 2: Running and Calibrating the Analysis
The Expert Panel
I assembled and led a panel of 3-4 usability experts to evaluate each task. Each expert independently scored every step in every task on a 1-3 scale: 1 for steps easily accomplished by the target user with low cognitive load, 2 for steps achievable but requiring notable effort, and 3 for steps likely to cause failure or task abandonment. After independent scoring, I facilitated calibration sessions where experts discussed their reasoning and reached a single decided score per step, not an average but a judgment call grounded in collective expertise. Calibration is essential to PURE's validity: without it, individual scoring differences undermine the reliability of the aggregate. Ensuring the panel was calibrated and that interrater agreement was strong before scores were finalized was a core part of my role as the program lead.
What the Scores Revealed
Six categories of cognitive load emerged consistently across all three products: insufficient context for decision making, excessive confirmation steps, poor information hierarchy, inconsistent UI patterns, unconventional UI patterns, and overwhelming information density. These categories became the backbone of the analysis, a through-line that made it possible to talk about any task in any product using a shared vocabulary. The scores also made visible exactly where our product stood out positively against competitors and where it fell short, giving the organization a data-backed map for roadmap prioritization.
Competitive Benchmark
PURE Scorecard: Sample Tasks
Our Product
62% Green
Connect
40% Green
MindTap
24% Green
Task
Our Product
Connect
MindTap
Reporting
Access average score & review student scores
G
R
Y
Understand an individual student's effort in the course
G
R
Y
Understand class insights holistically
R
R
R
Assessment Maintenance
Customize a grading policy to allow late submissions
G
Y
R
Find a question & add it to a prebuilt homework
Y
Y
R
Course Setup
Assign activities in batch
G
G
Y
Copy a course
Y
Y
R
Green: Easily accomplished, low cognitive load
Yellow: Achievable with notable effort
Red: Difficult, likely to cause abandonment
Phase 3: Crafting the Executive Narrative
The Problem with Raw Scores
The first challenge in communicating PURE findings was a counterintuitive one: higher scores do not automatically mean worse performance. PURE reflects both the number of steps in a task and the cognitive load at each step. A complex multi-step workflow will naturally produce a higher score than a simple one, even if it is well designed. Without that context, executives could easily misread the data and lose confidence in the findings.
The sandwich analogy made this clear. A peanut butter and jelly sandwich takes 4 steps and scores a 4. A club sandwich takes 9 steps and scores a 9. A French hare stew takes 14 steps over two days and scores a 21. The stew's high score is not a failure. Some complexity is inherent to the task. The real question is whether the cognitive load at each step is appropriate for its complexity, and where unnecessary friction can be removed.
Understanding PURE Scores: Complexity Matters
🍞
Peanut Butter & Jelly
4 Steps · 3 Minutes
G–4
Simple task, simple score. A 4 is exactly what you would expect.
🥪
Club Sandwich
9 Steps · 10 Minutes
G–9
More complex task, higher score, but still Green. The difficulty is appropriate to the task.
🥘
Lièvre à la Royale
14 Steps · 2 Days
Y–21
High score, but this is French hare stew. Some complexity is inherent. The question is where unnecessary friction can be removed.
From the PURE analysis deck: scores reflect both number of steps and cognitive load per step, not difficulty alone
Partnering with Data Analytics
To make the PURE findings actionable for a business audience, we pulled product data analytics to show how increased cognitive load mapped to real patterns in user behavior. We looked at support chatbot containment rates (the percentage of cases by category that users could resolve without escalating to a human agent) and compared them against the tasks that scored highest for friction in the PURE analysis. The correlation was clear: the tasks where instructors struggled most in the expert evaluation were the same categories generating the highest volume of escalated support cases. That connection translated friction from a usability problem into an operational one, and gave leadership a concrete way to think about which improvements would have the most leverage.
Data Analytics Layer
PURE Friction vs. Support Escalation: Where They Align
Task
PURE Score
Support Escalation Pattern
Key Friction to Address
Connect course to LMS
Y
13
LMS troubleshooting among the highest escalation categories; majority of cases could not be resolved by support chatbot
No guidance that a required step must be completed first; grading options difficult to compare; course list is unsorted and hard to navigate
Understand class insights holistically
R
3
Insights and reporting conflated in the product; instructors cannot navigate to the data they need without support
Dense text, competing calls to action, and multiple link types that direct to unrelated pages; unclear relationship between panels
Grant extra time on a timed assignment
Y
9
Accommodation requests a recurring source of support contact; instructors unsure how inputs relate to each other
"Exception" and "Accommodation" used interchangeably; instructors must calculate time extensions manually with no guidance
Set up a new pre-built course
Y
11
Course setup questions frequently escalated; instructors feel uncertain about the weight of early decisions
Left-to-right radio buttons don't follow conventions; instructions unclear given permanence of decisions; tight spacing creates unintended visual groupings
PURE scores and support escalation patterns analyzed in tandem to prioritize where reducing cognitive load would have the greatest operational impact
Building the Overarching Story
Rather than presenting 25 disconnected task scores, I organized all findings around the six recurring cognitive load categories that surfaced across every product vertical and every competitor. These categories became the through-line of the presentation, a framework that let stakeholders see the systemic patterns, not just individual issues. The work of making that story legible to a non-research audience was as important as the analysis itself: executives needed a mental model, not a spreadsheet. Product managers needed clear prioritization signals, not a list of everything that was hard. Designers needed specific, actionable friction points they could do something about. Building a single narrative that served all three of those audiences at once was where the research became strategy.
Phase 4: Translating Findings into Product Decisions
The Main Presentation
The full PURE readout was presented to executive stakeholders, product directors, and design and product management teams. The competitive benchmarking made the stakes clear: our product was outperforming both competitors overall, but there were specific workflows (particularly in Reporting) where the gaps were narrow or unfavorable. That specificity was what made the conversation productive. Rather than a general mandate to improve UX, leadership could discuss exactly where to compete, where to hold, and where to invest to move scores in the next year.
Per-Vertical Roadmap Meetings
After the main presentation, I met individually with each product owner responsible for a specific area of the product. These were working sessions, not a second presentation but a conversation about which improvements were most feasible to prioritize given each team's roadmap and the competitive picture. The benchmarking data was especially useful here, because it gave product owners a way to frame prioritization decisions around business outcomes (winning new accounts versus retaining existing ones) rather than usability scores alone. All recommendations were documented and entered into ProductBoard for tracking and prioritization.
Phase 5: Making It Repeatable and Scalable
Coaching the Team
Running the analysis myself was never the goal. After the first year, I coached team members through the methodology: how to define step boundaries rigorously, how to facilitate calibration discussions without leading the group toward a predetermined score, and how to push back when an expert's reasoning didn't hold up under scrutiny. The goal was not just to hand over a process document, but to develop the judgment the program required. By the second year, the team could run it without me, which meant the research infrastructure was self-sustaining well past the end of the engagement.
A Shared Language for Design Critique
The six cognitive load categories became part of how the organization talked about design quality in general. In critique sessions, designers and product managers began using them as a framework for assessing their own work, flagging when a flow had insufficient context or when confirmation steps felt excessive before a study was ever run. The PURE program did not just produce an annual report. It changed how the team evaluated quality in day-to-day work.
Outcomes
Competitive Position
Our product scored 62% Green across 25 tasks, outperforming McGraw Hill Connect (40%) and Cengage MindTap (24%)
Competitive benchmarking gave the organization its first data-backed view of UX position in the market, informing strategic decisions about where to invest in winning new accounts versus retaining existing ones
Reporting emerged as the highest-priority area for improvement, given its role in instructor retention and the competitive gaps identified against both products
Research and Organizational Impact
All findings entered into ProductBoard for prioritization, directly influencing each product vertical's roadmap
Per-vertical roadmap meetings gave each product owner a clear, contextual view of where to act first based on competitive gaps and business priorities
Program ran for two consecutive years with scores tracked YOY, establishing the first repeatable research infrastructure for measuring UX quality at this organization
PURE framework became a shared language in design critique, giving teams a way to self-assess designs against usability standards before research was needed
Team members coached to run the analysis independently, making the program self-sustaining beyond the consulting engagement